SPDE-Visuals
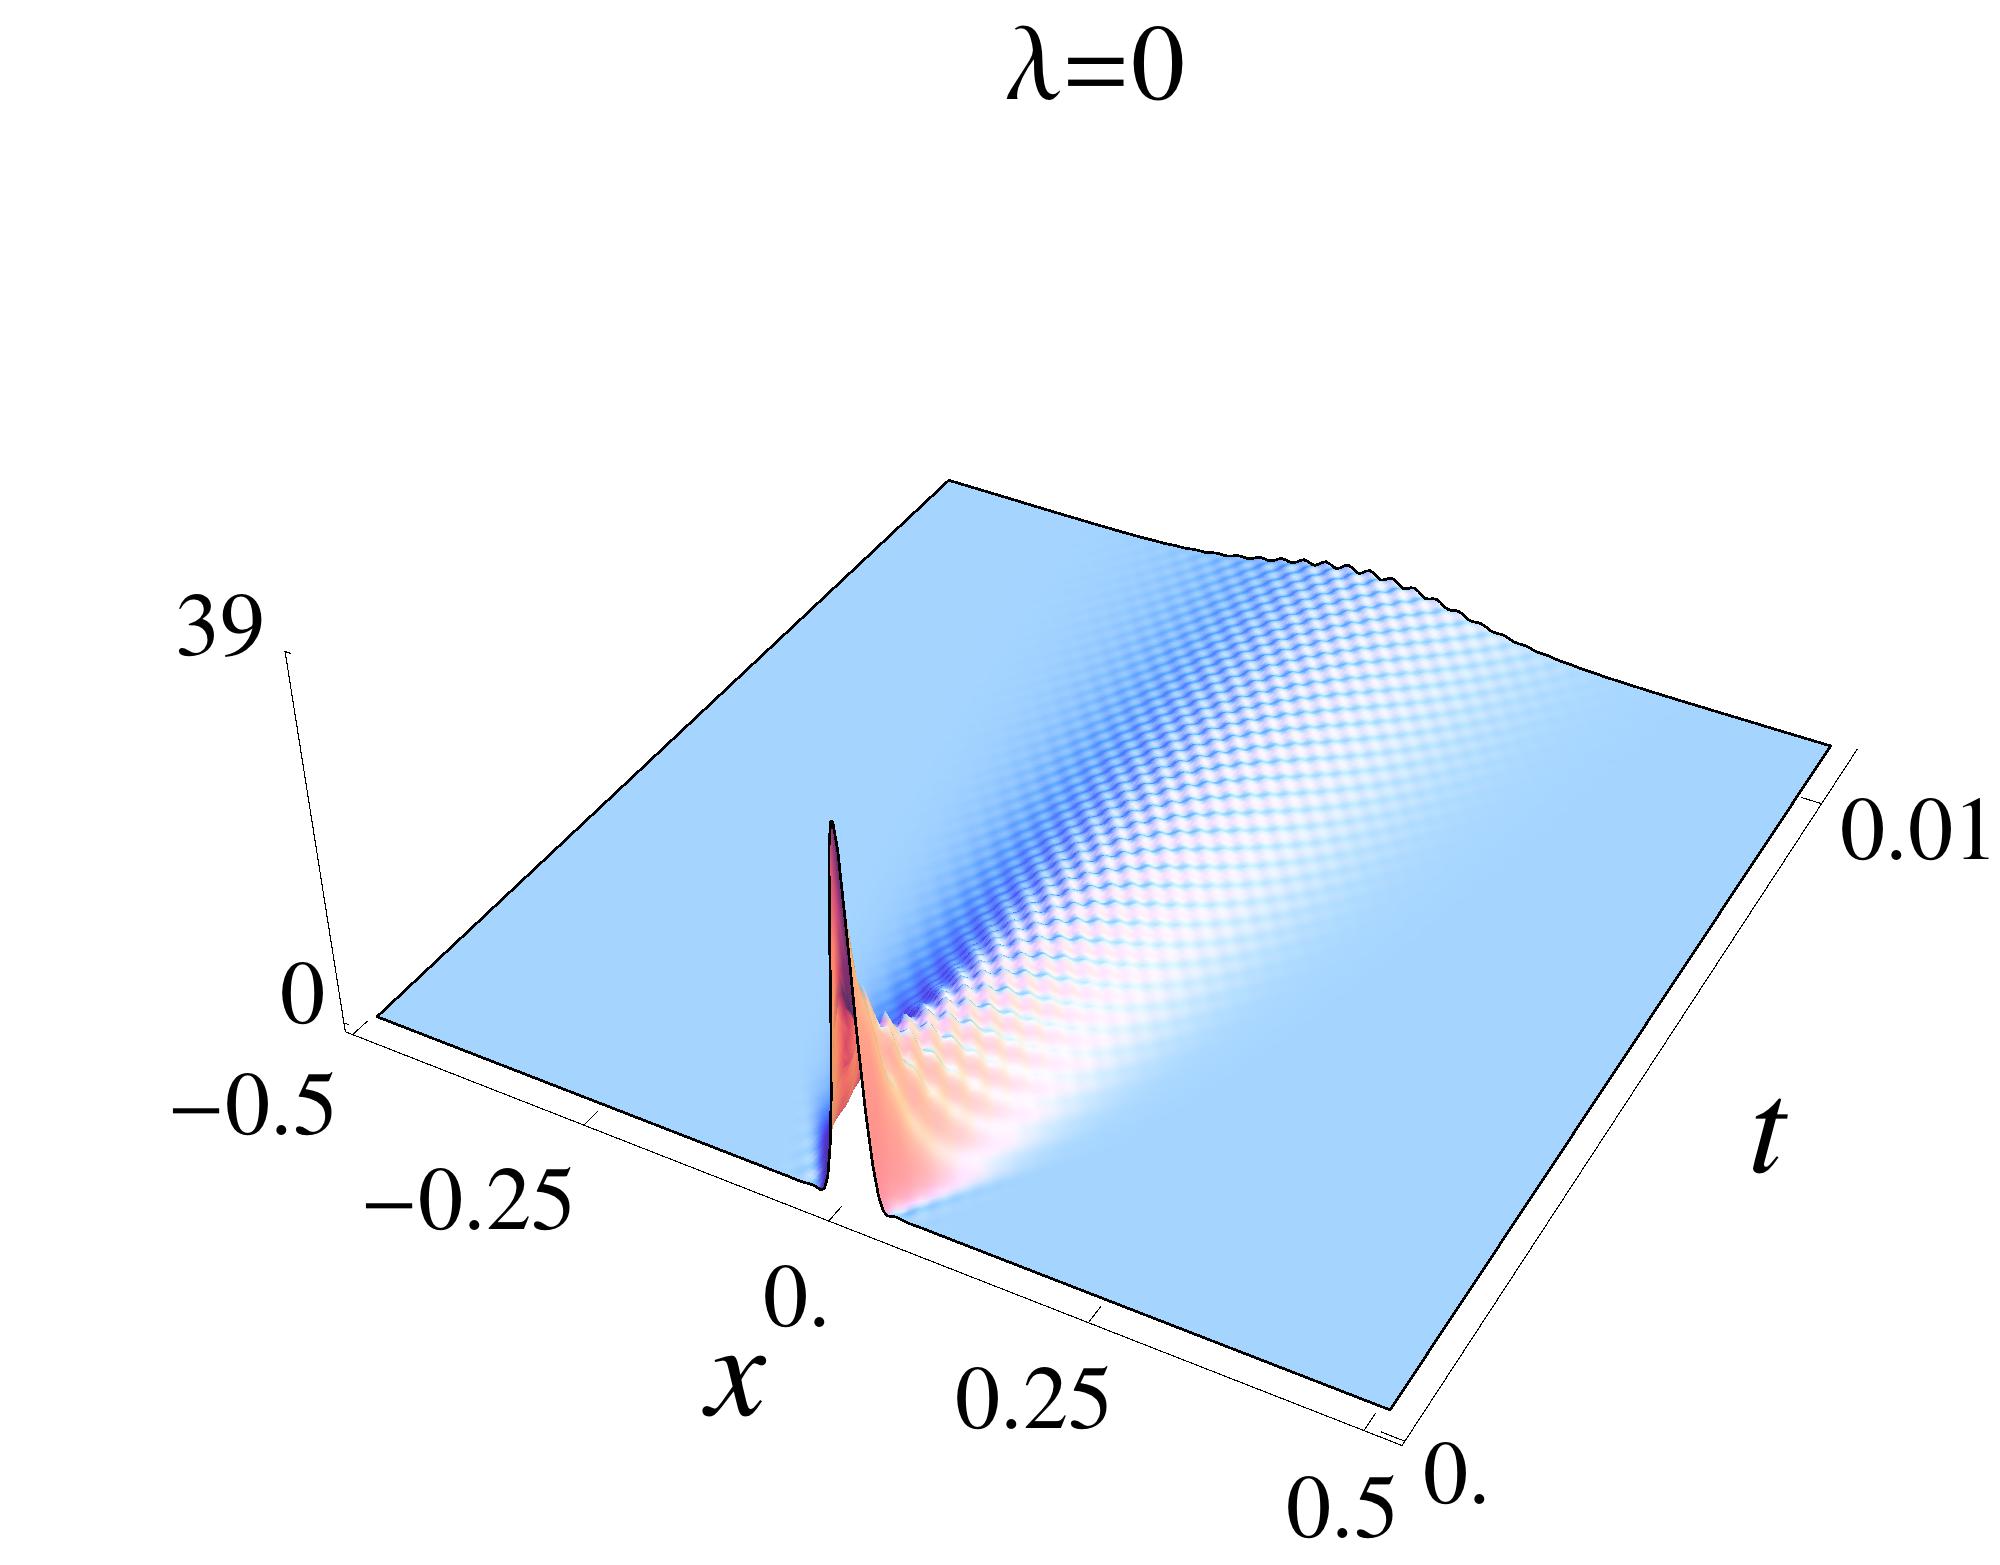
In this folder, the images are generated to illustrate the propagation of tall peaks when the stochastic heat equation started from a localized initial condition.
Peak Propagation - Image Collection
This folder contains a collection of visualizations related to peak propagation under various conditions. The naming convention for the files is as follows:
- Delta: Refers to the Dirac delta initial condition.
- L: Refers to the parameter Lambda (λ).
- Number after L: Represents the value of Lambda (λ).
- cut: Indicates the plot is cut at a height of 500.
- neg: Indicates the plot has a dark background.
Image Formats
The visualizations are provided in the following formats:
- JPEG: Optimized for quick preview.
- PDF: High-resolution vector format.
- EPS: Suitable for LaTeX and academic publications.
- DAT: Raw data files for further analysis.
File List with Previews
Dirac Delta Initial Condition (δ), Lambda (λ) Values
JPEG Previews:
 Lambda = 0
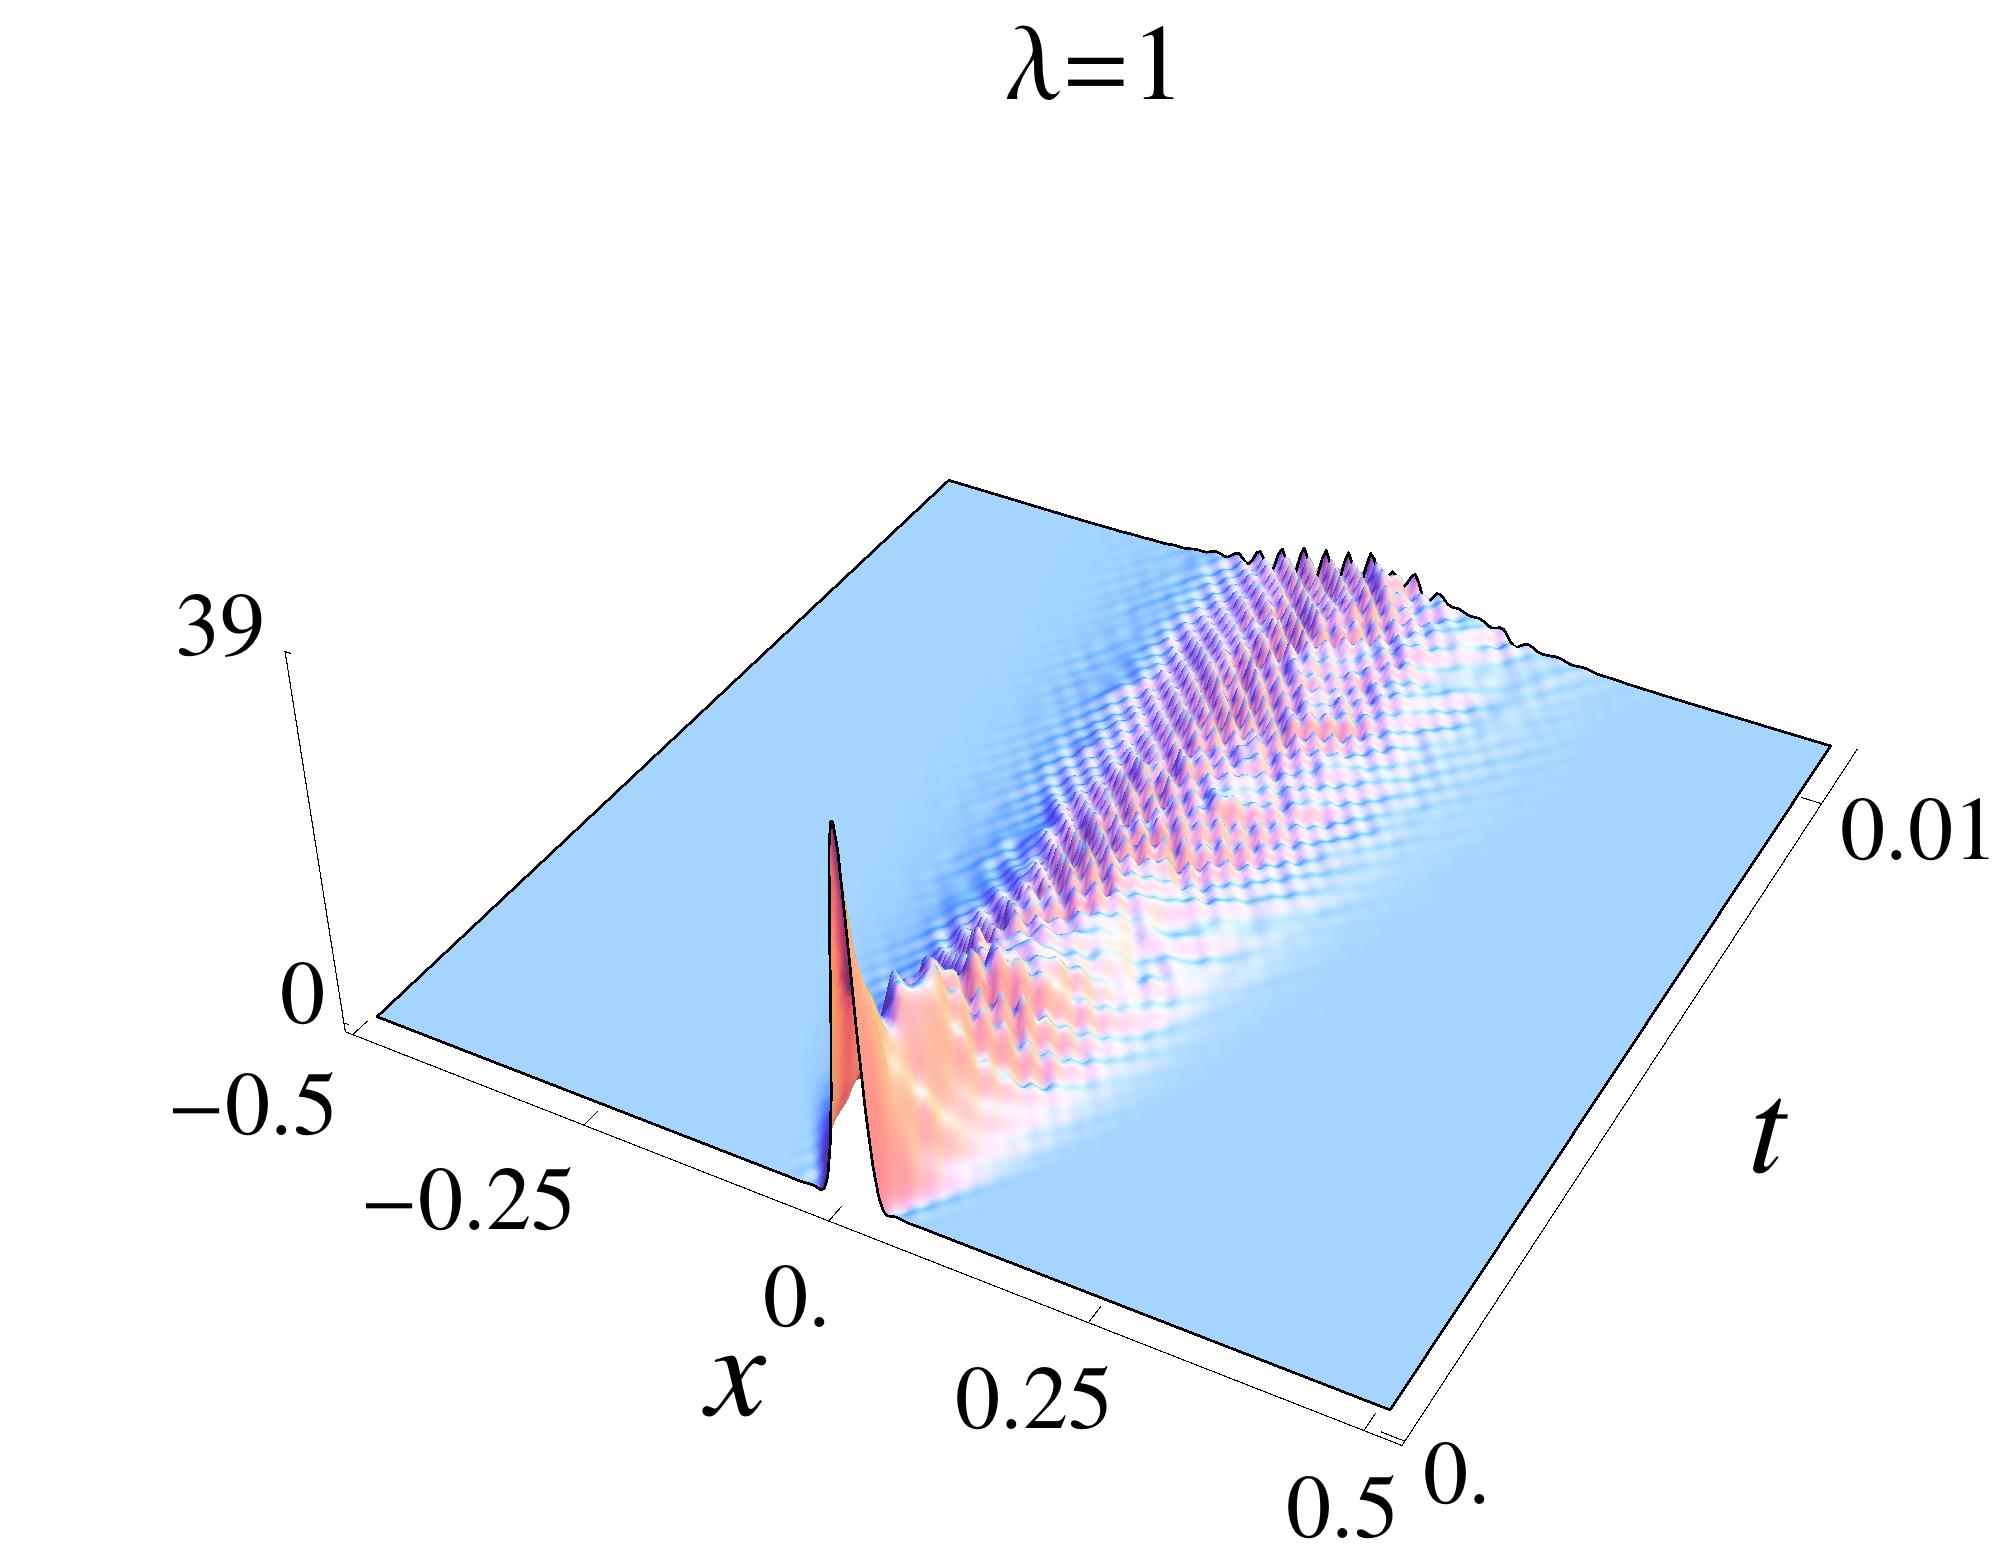 Lambda = 1
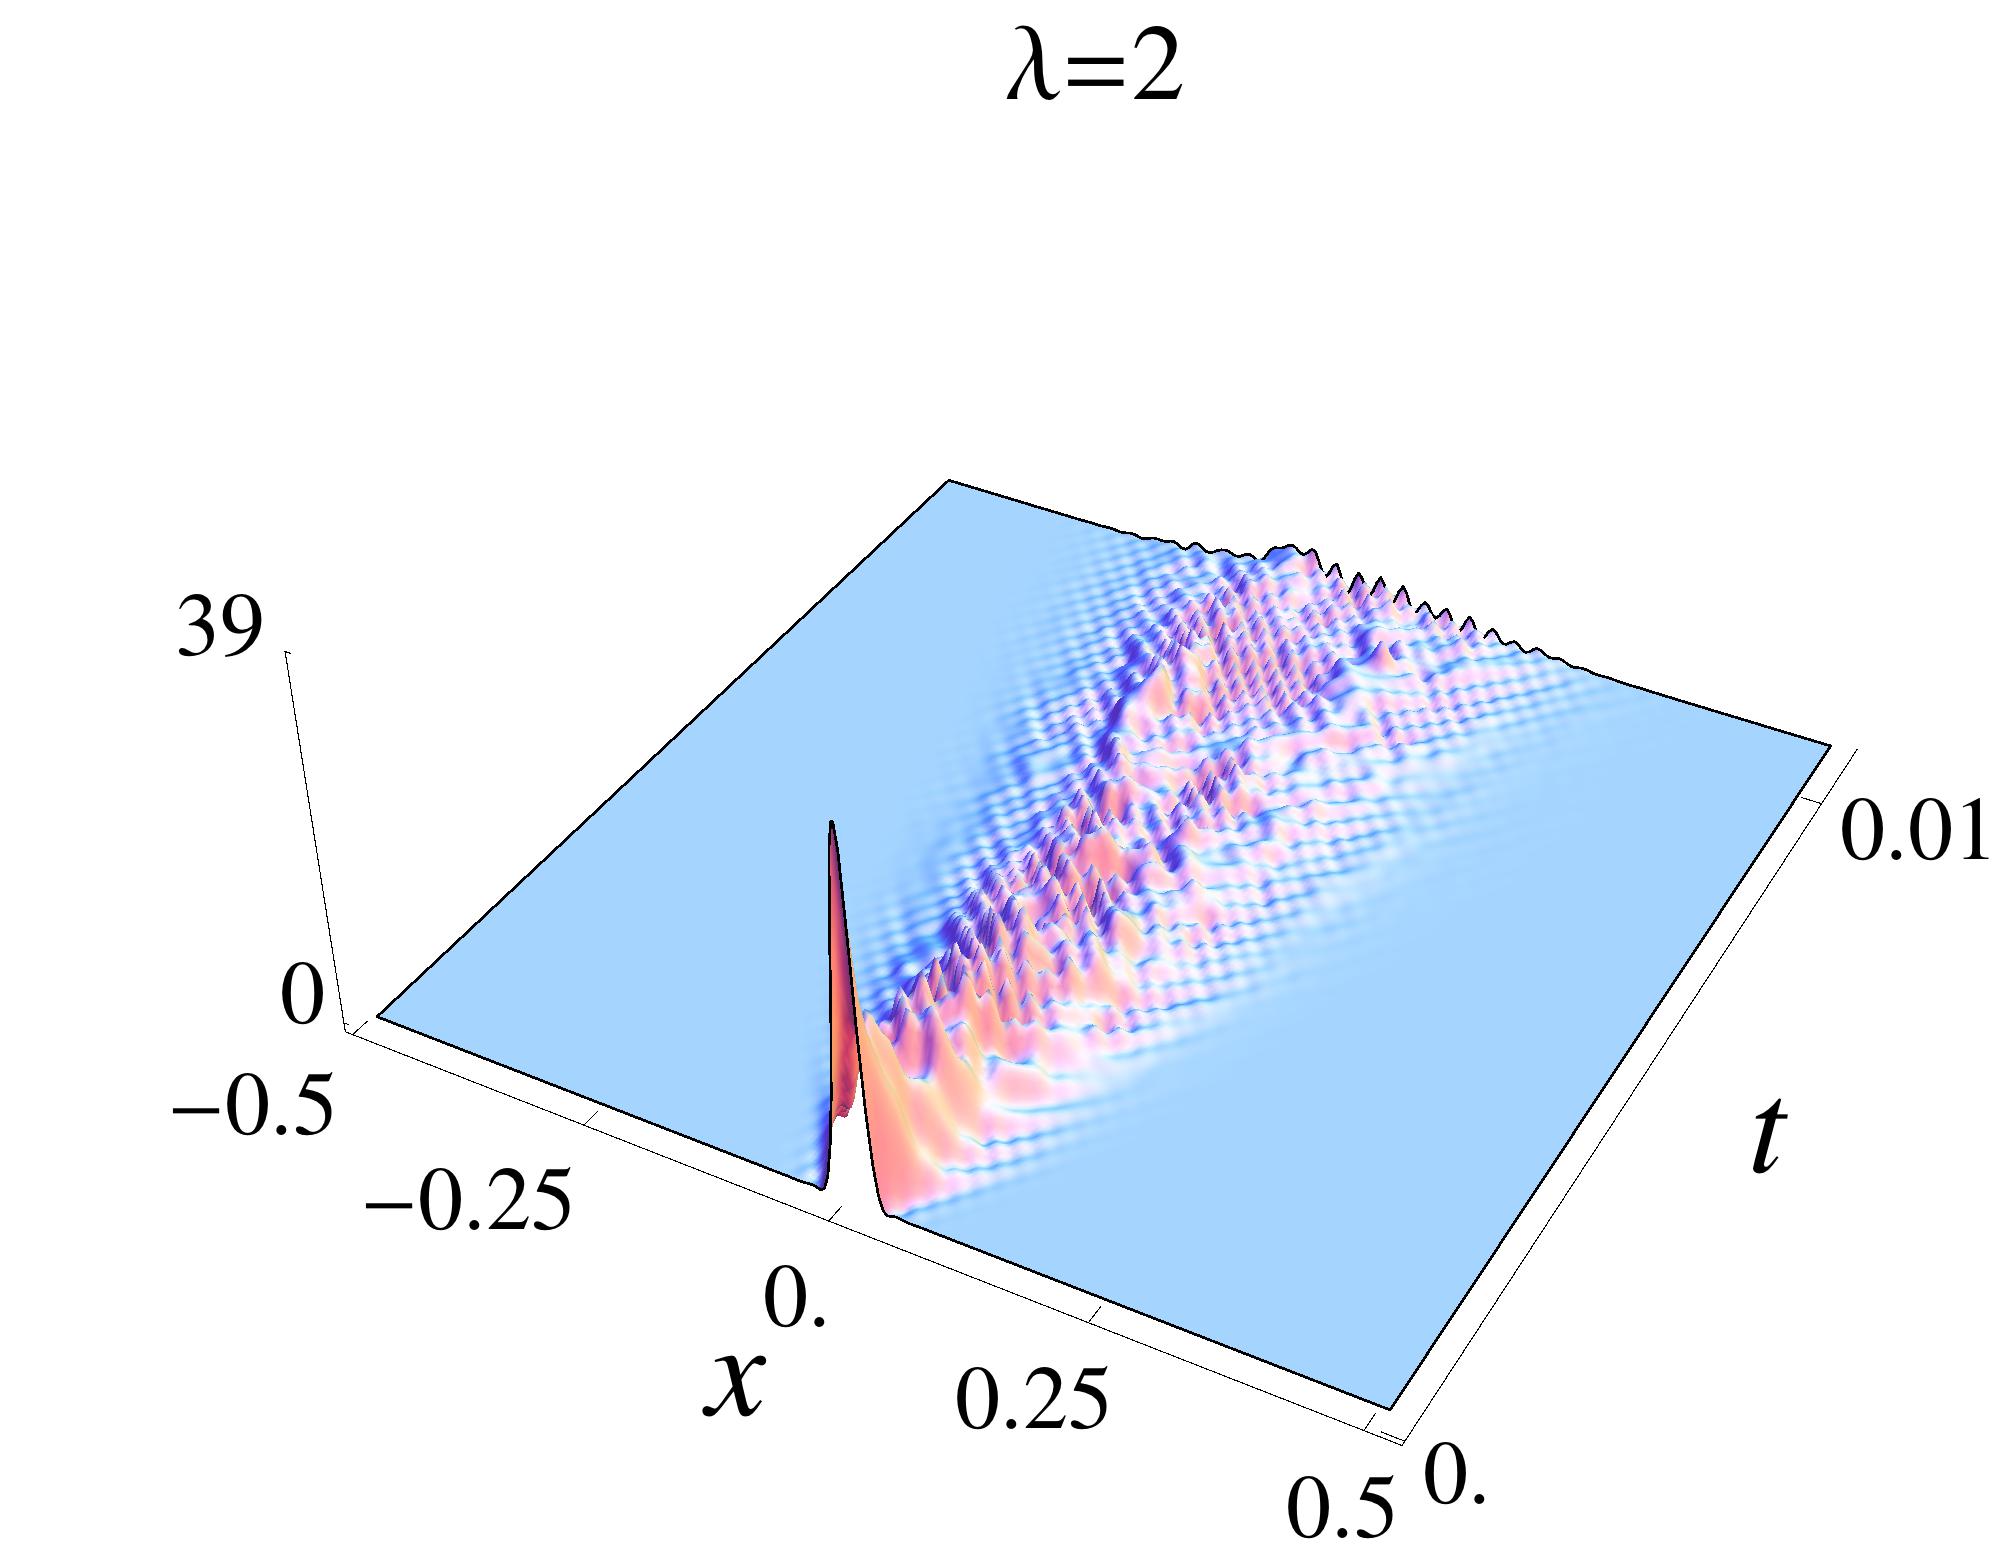 Lambda = 2
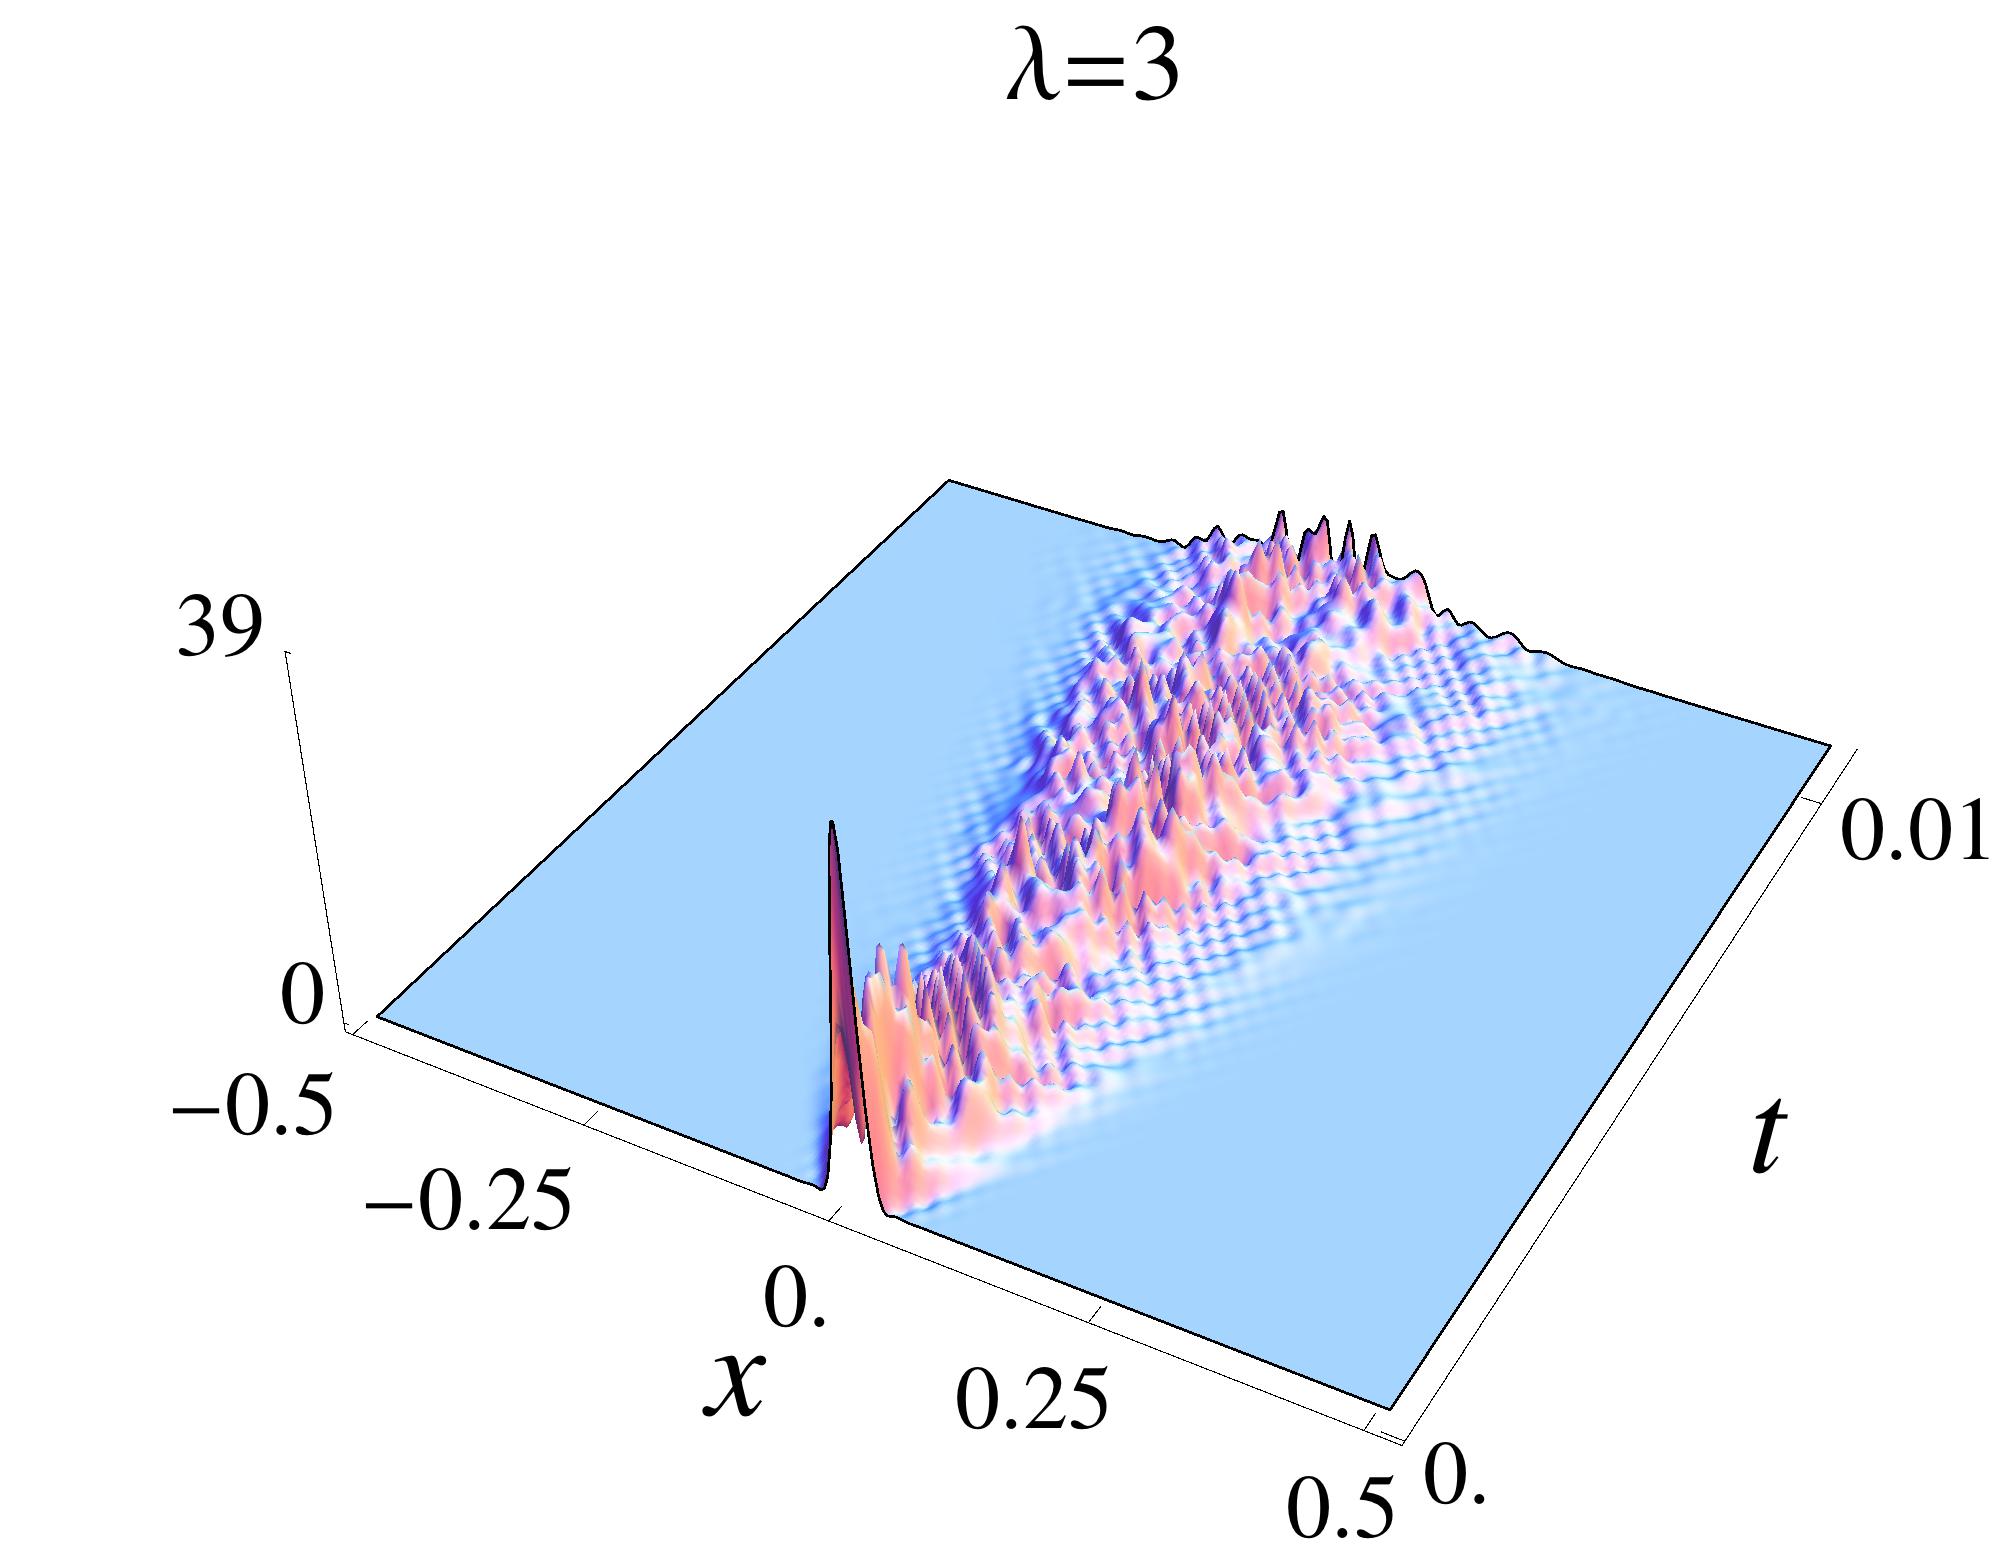 Lambda = 3
 Lambda = 4
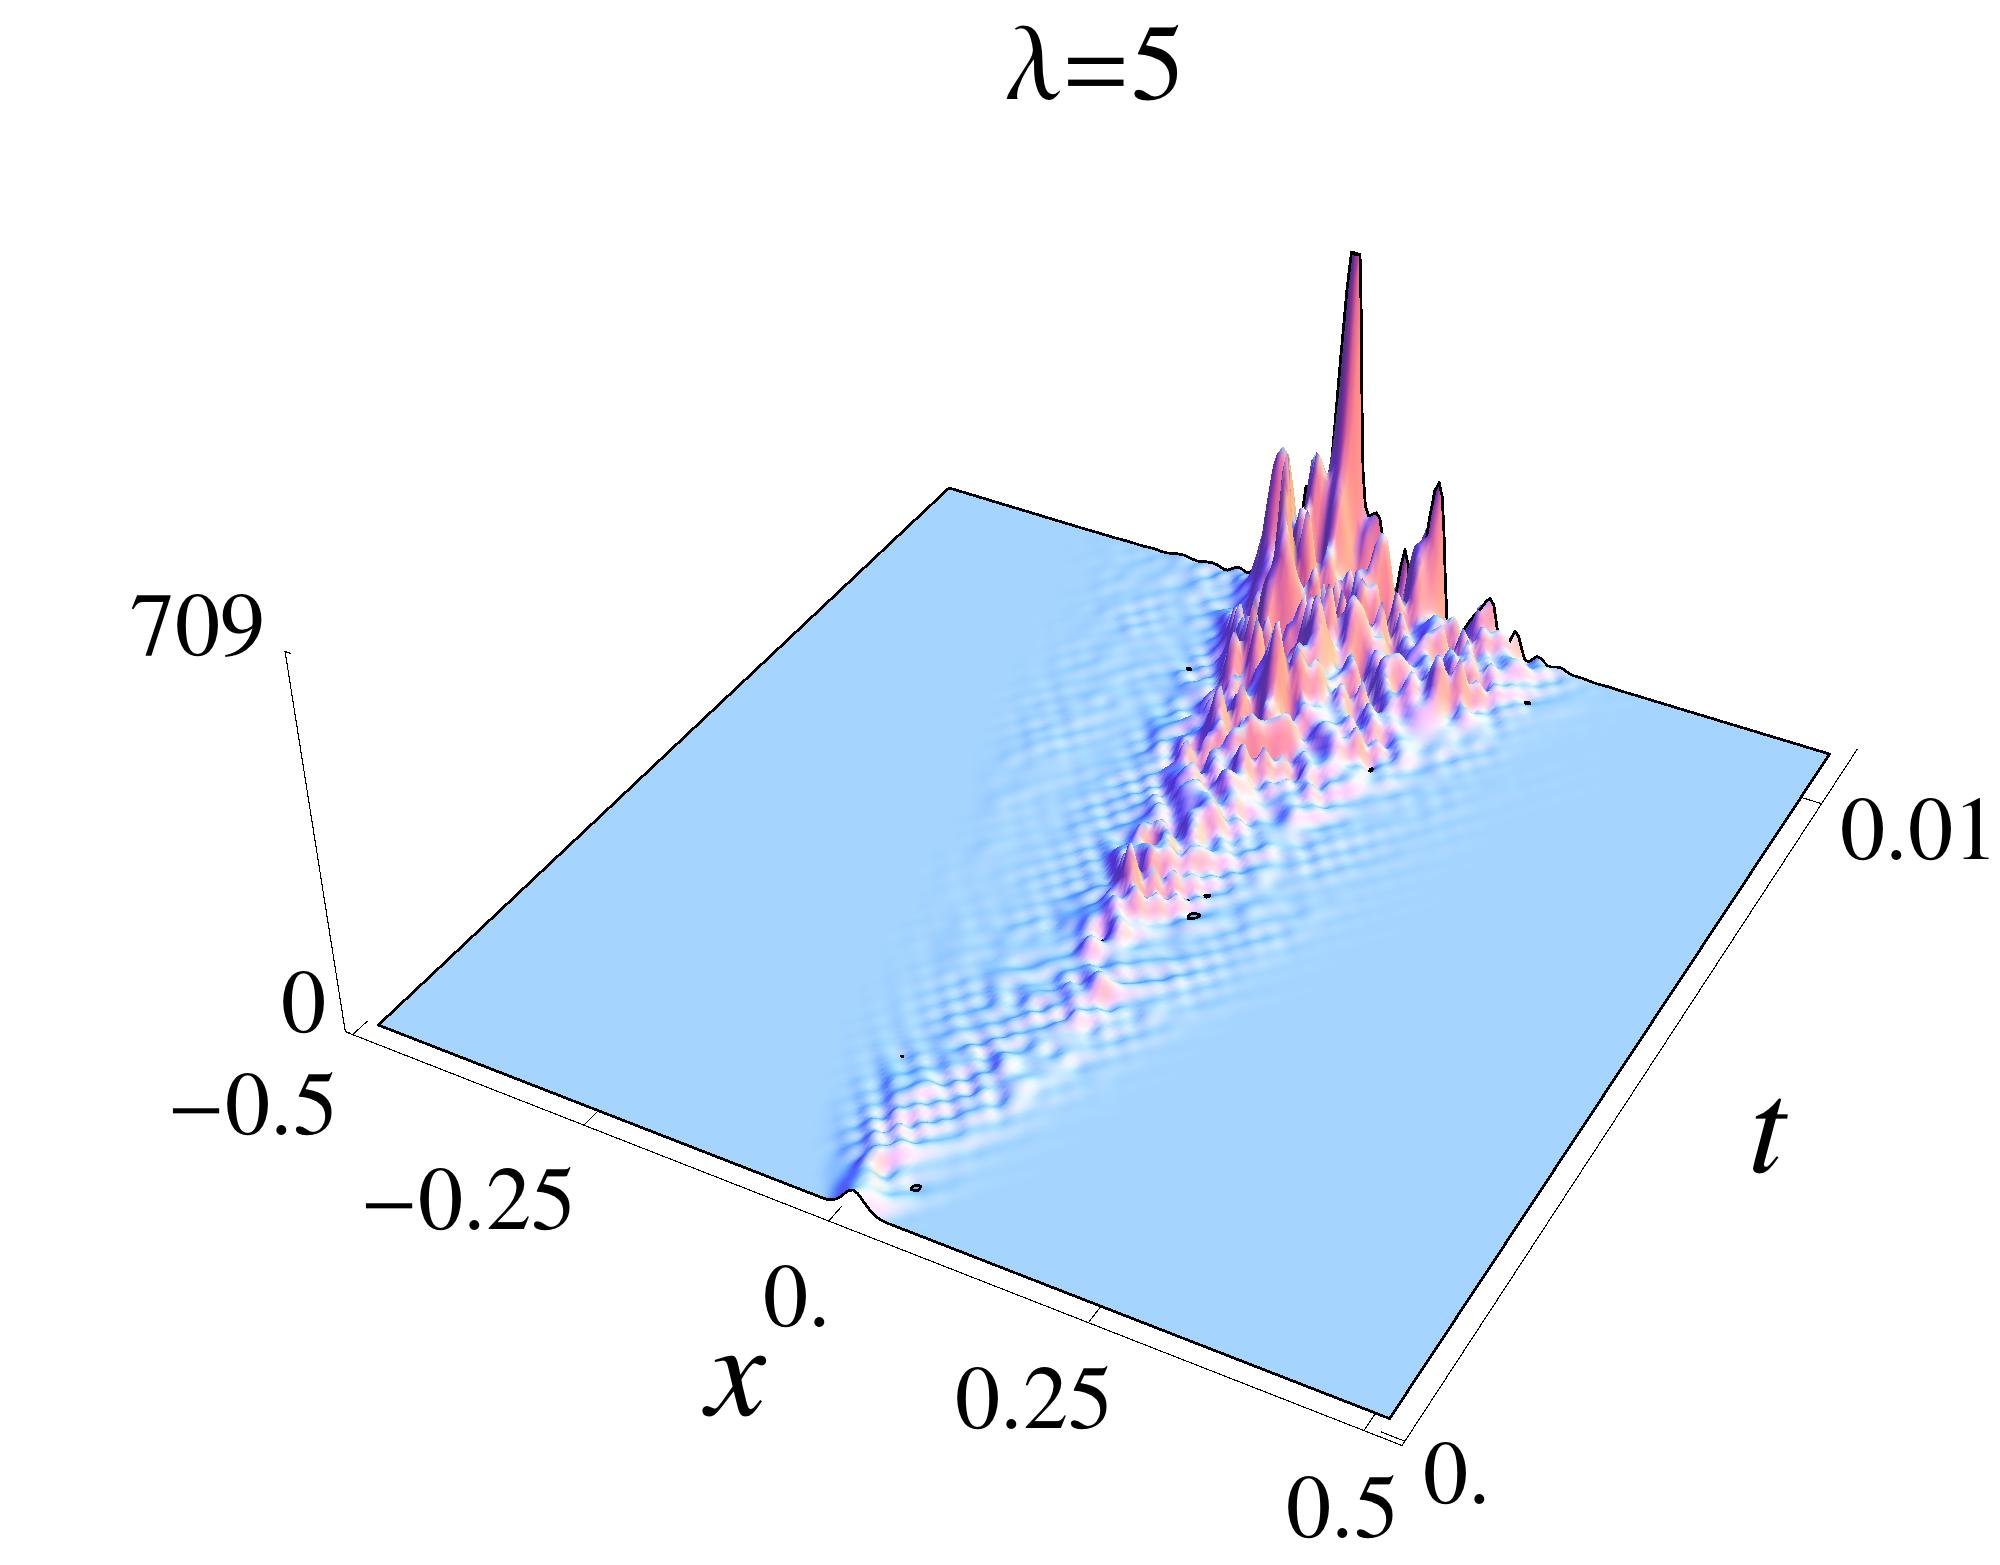 Lambda = 5
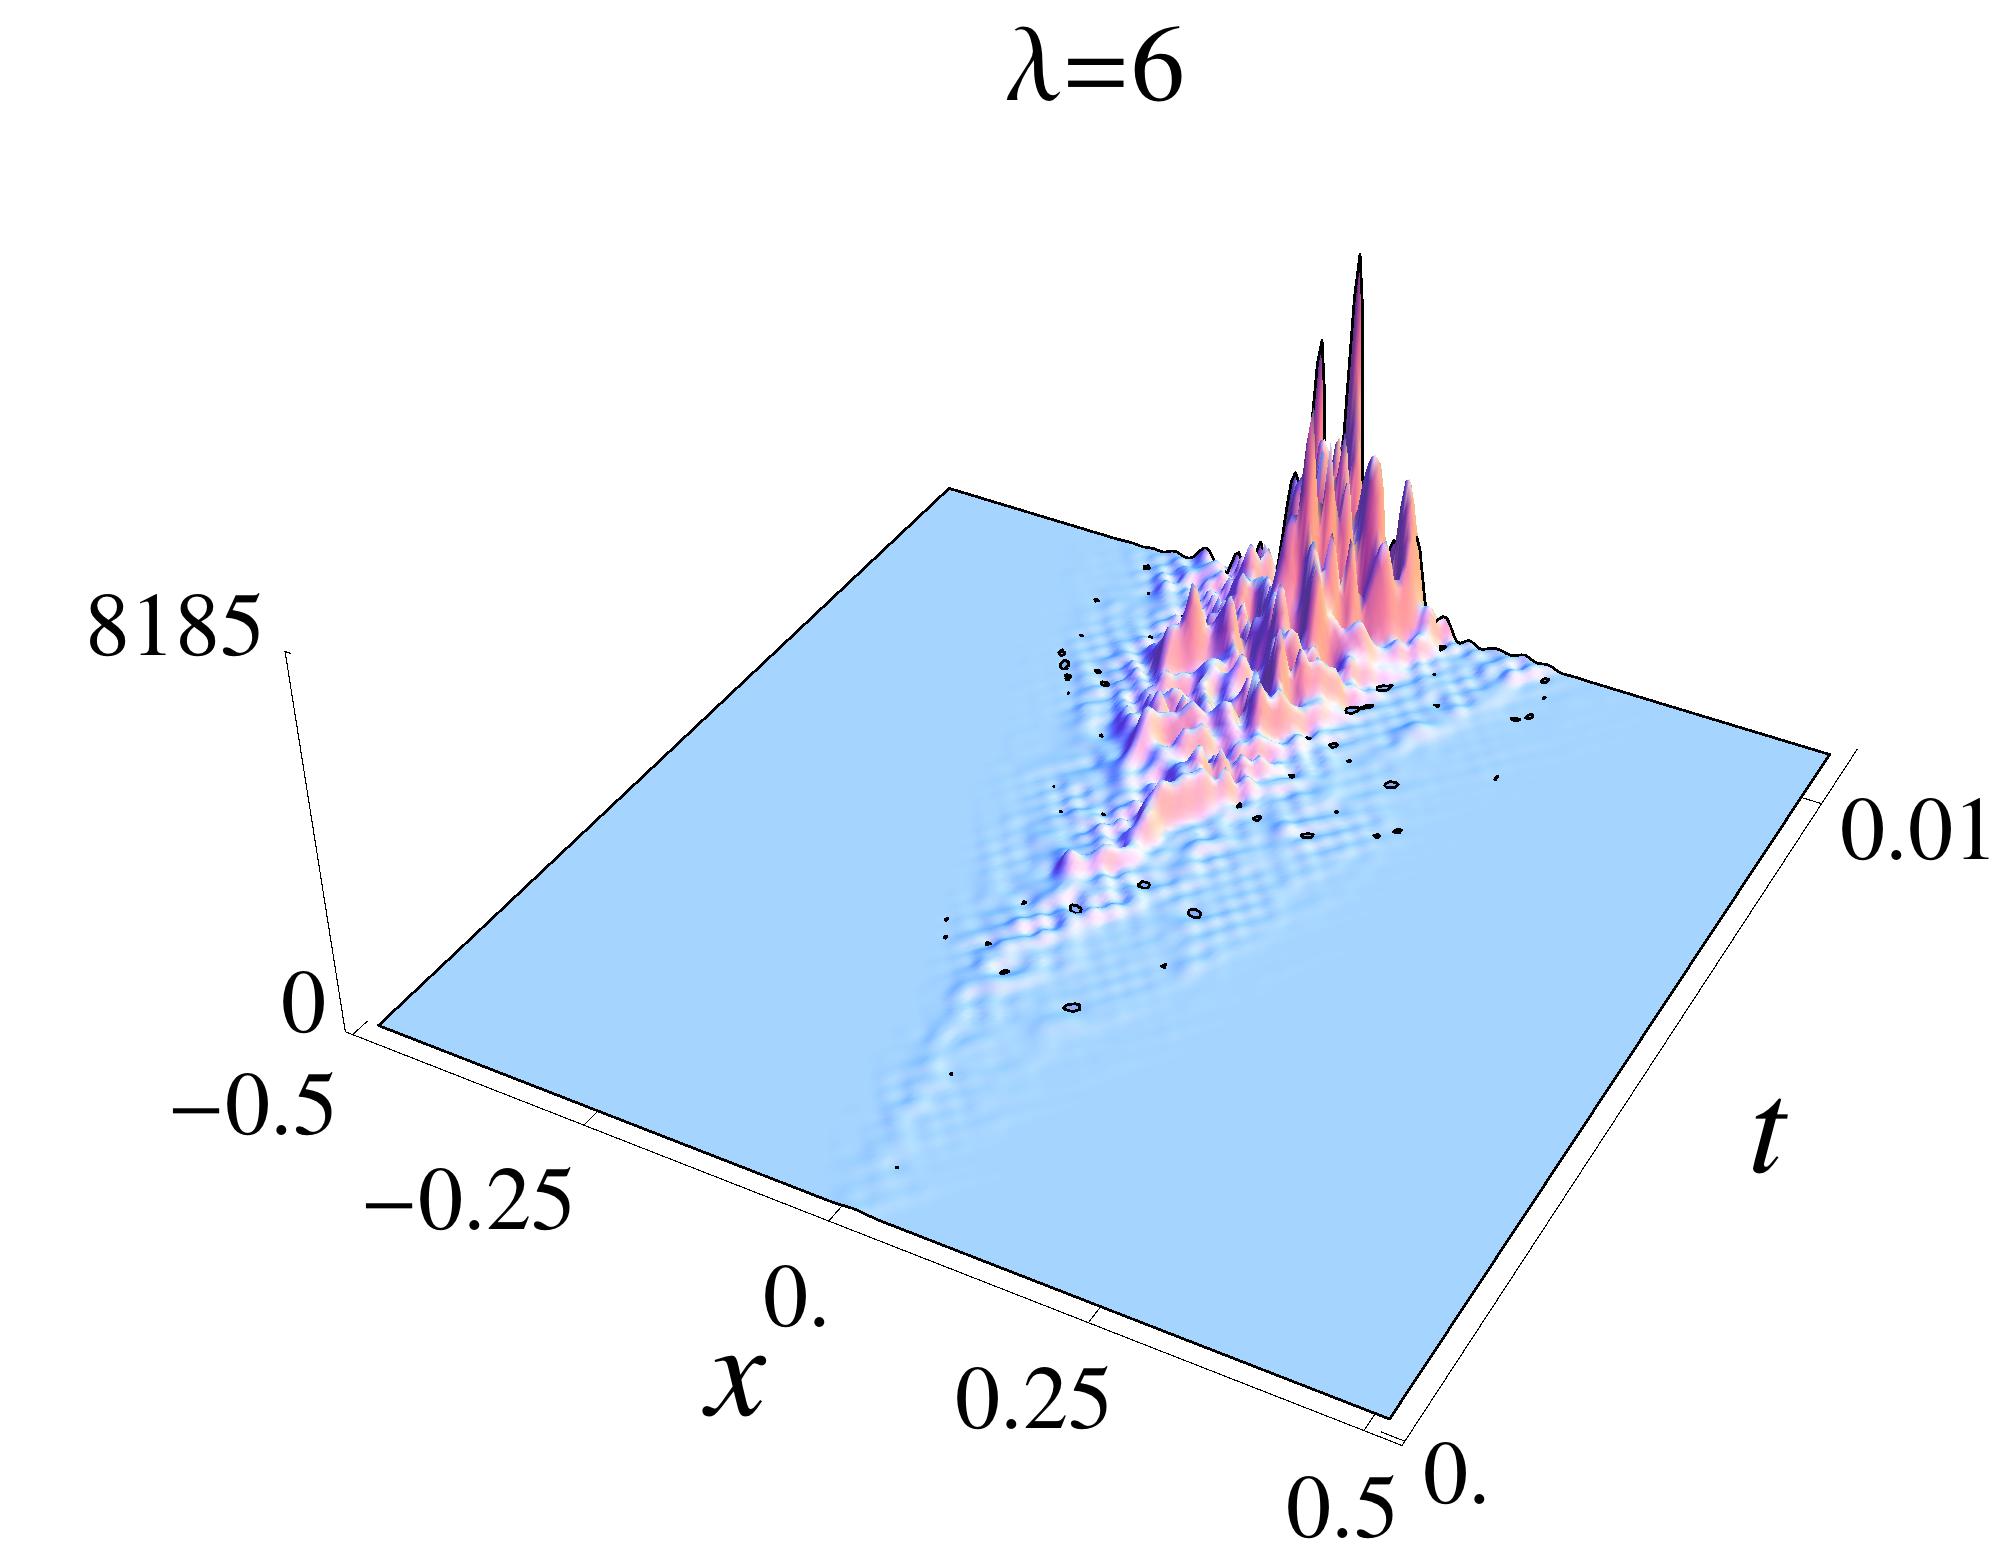 Lambda = 6
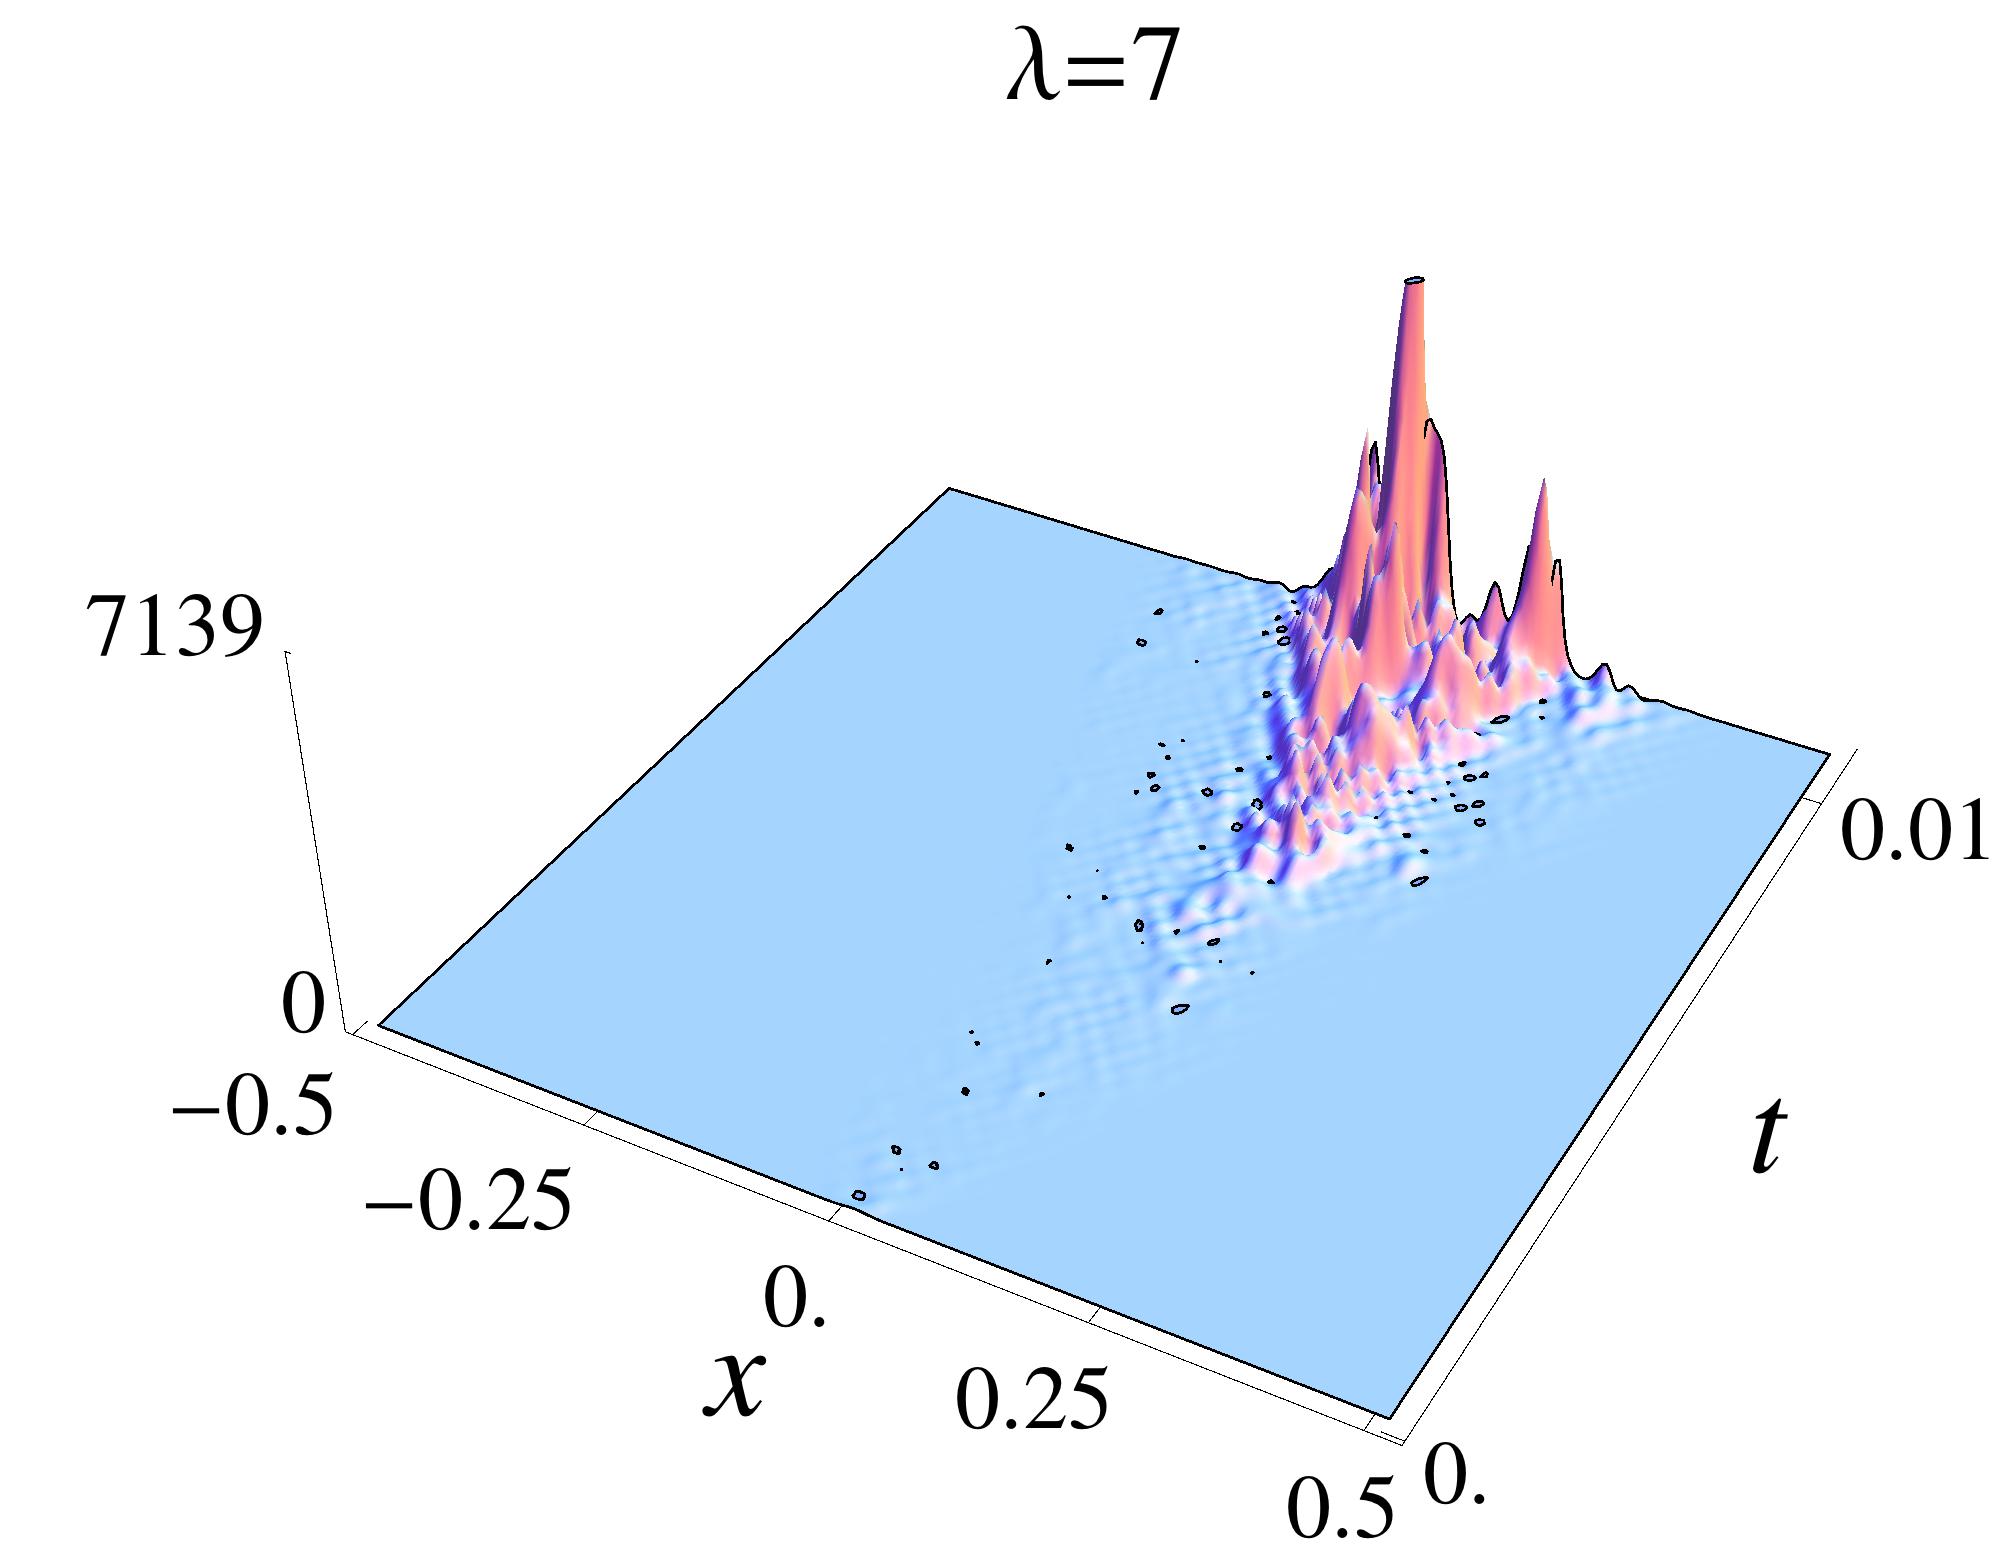 Lambda = 7
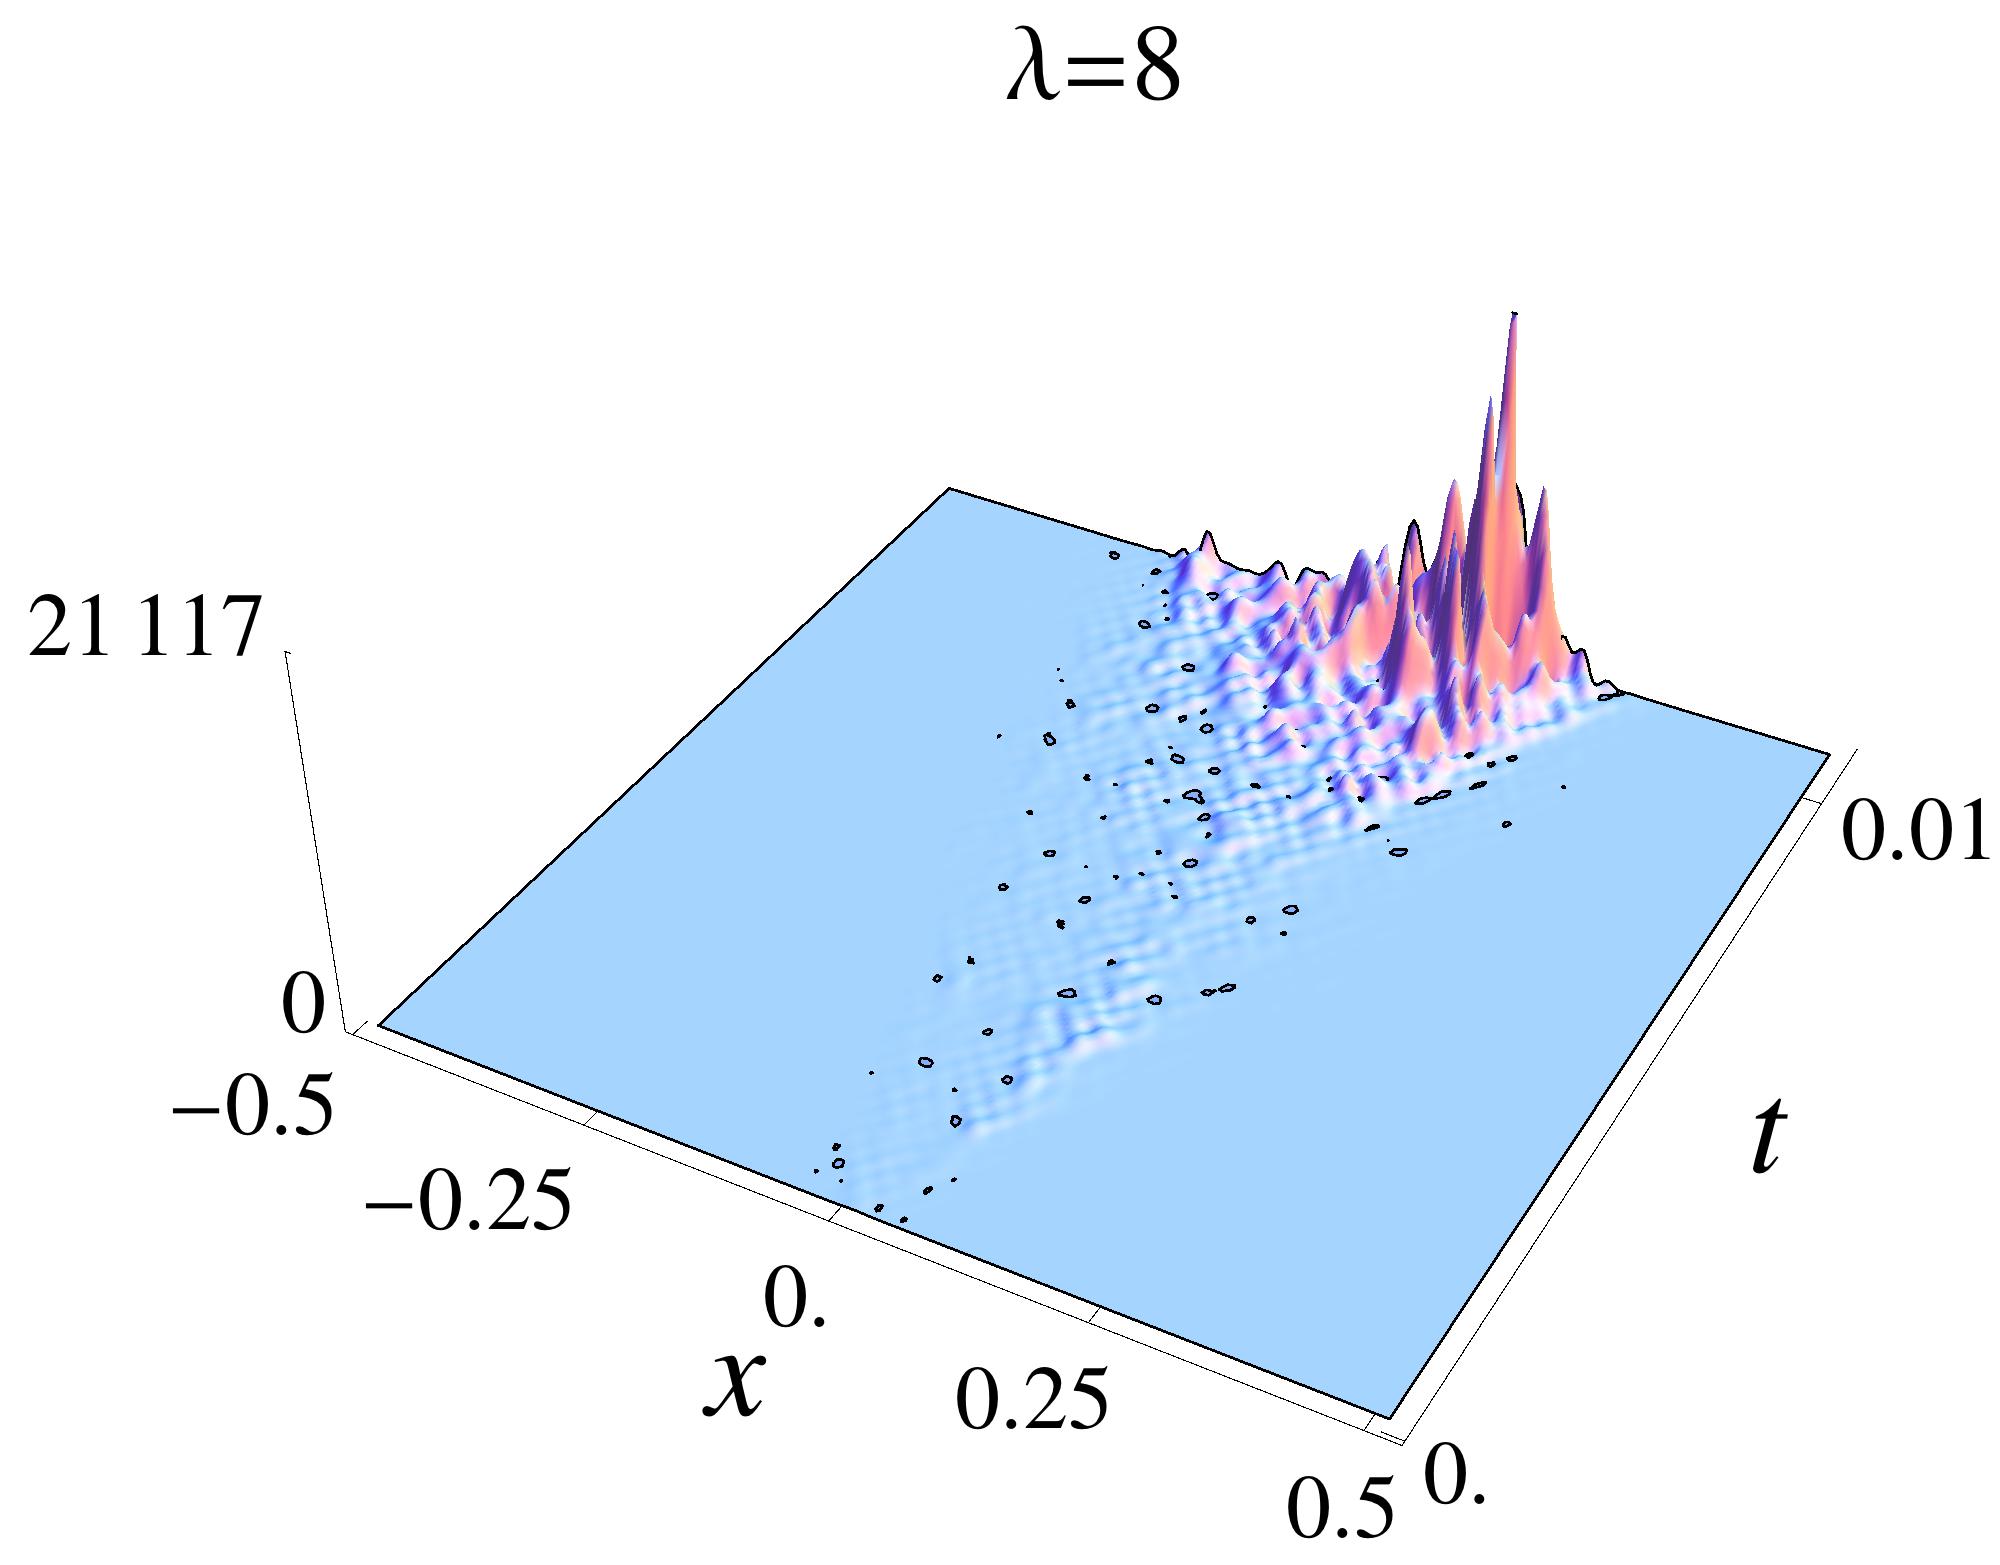 Lambda = 8
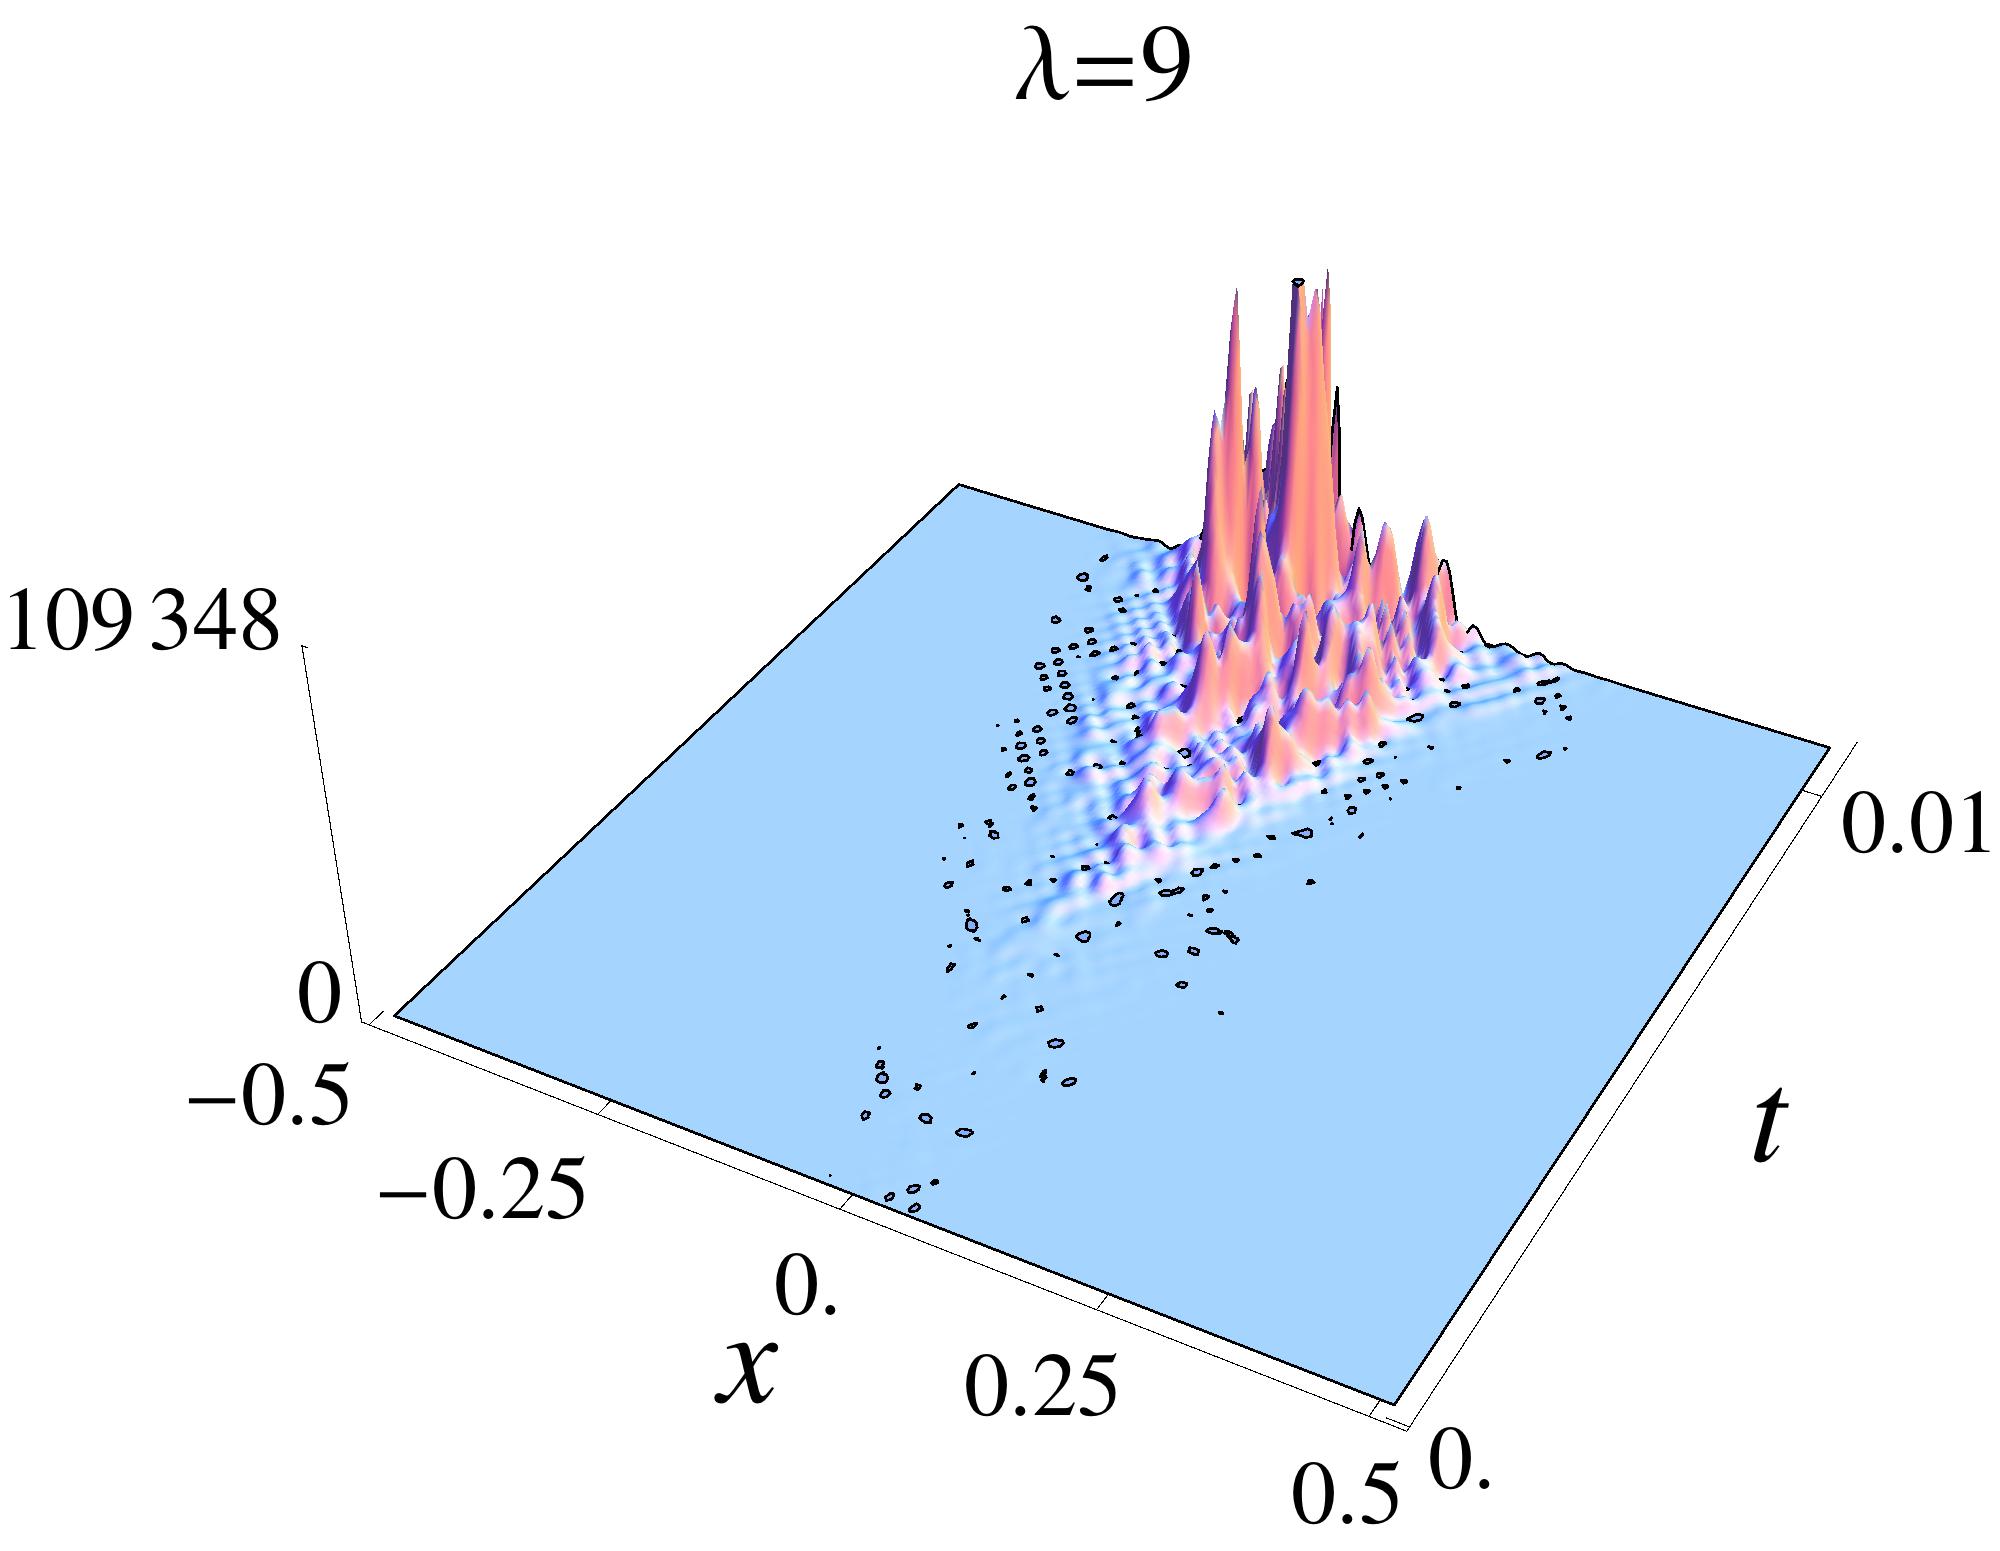 Lambda = 9
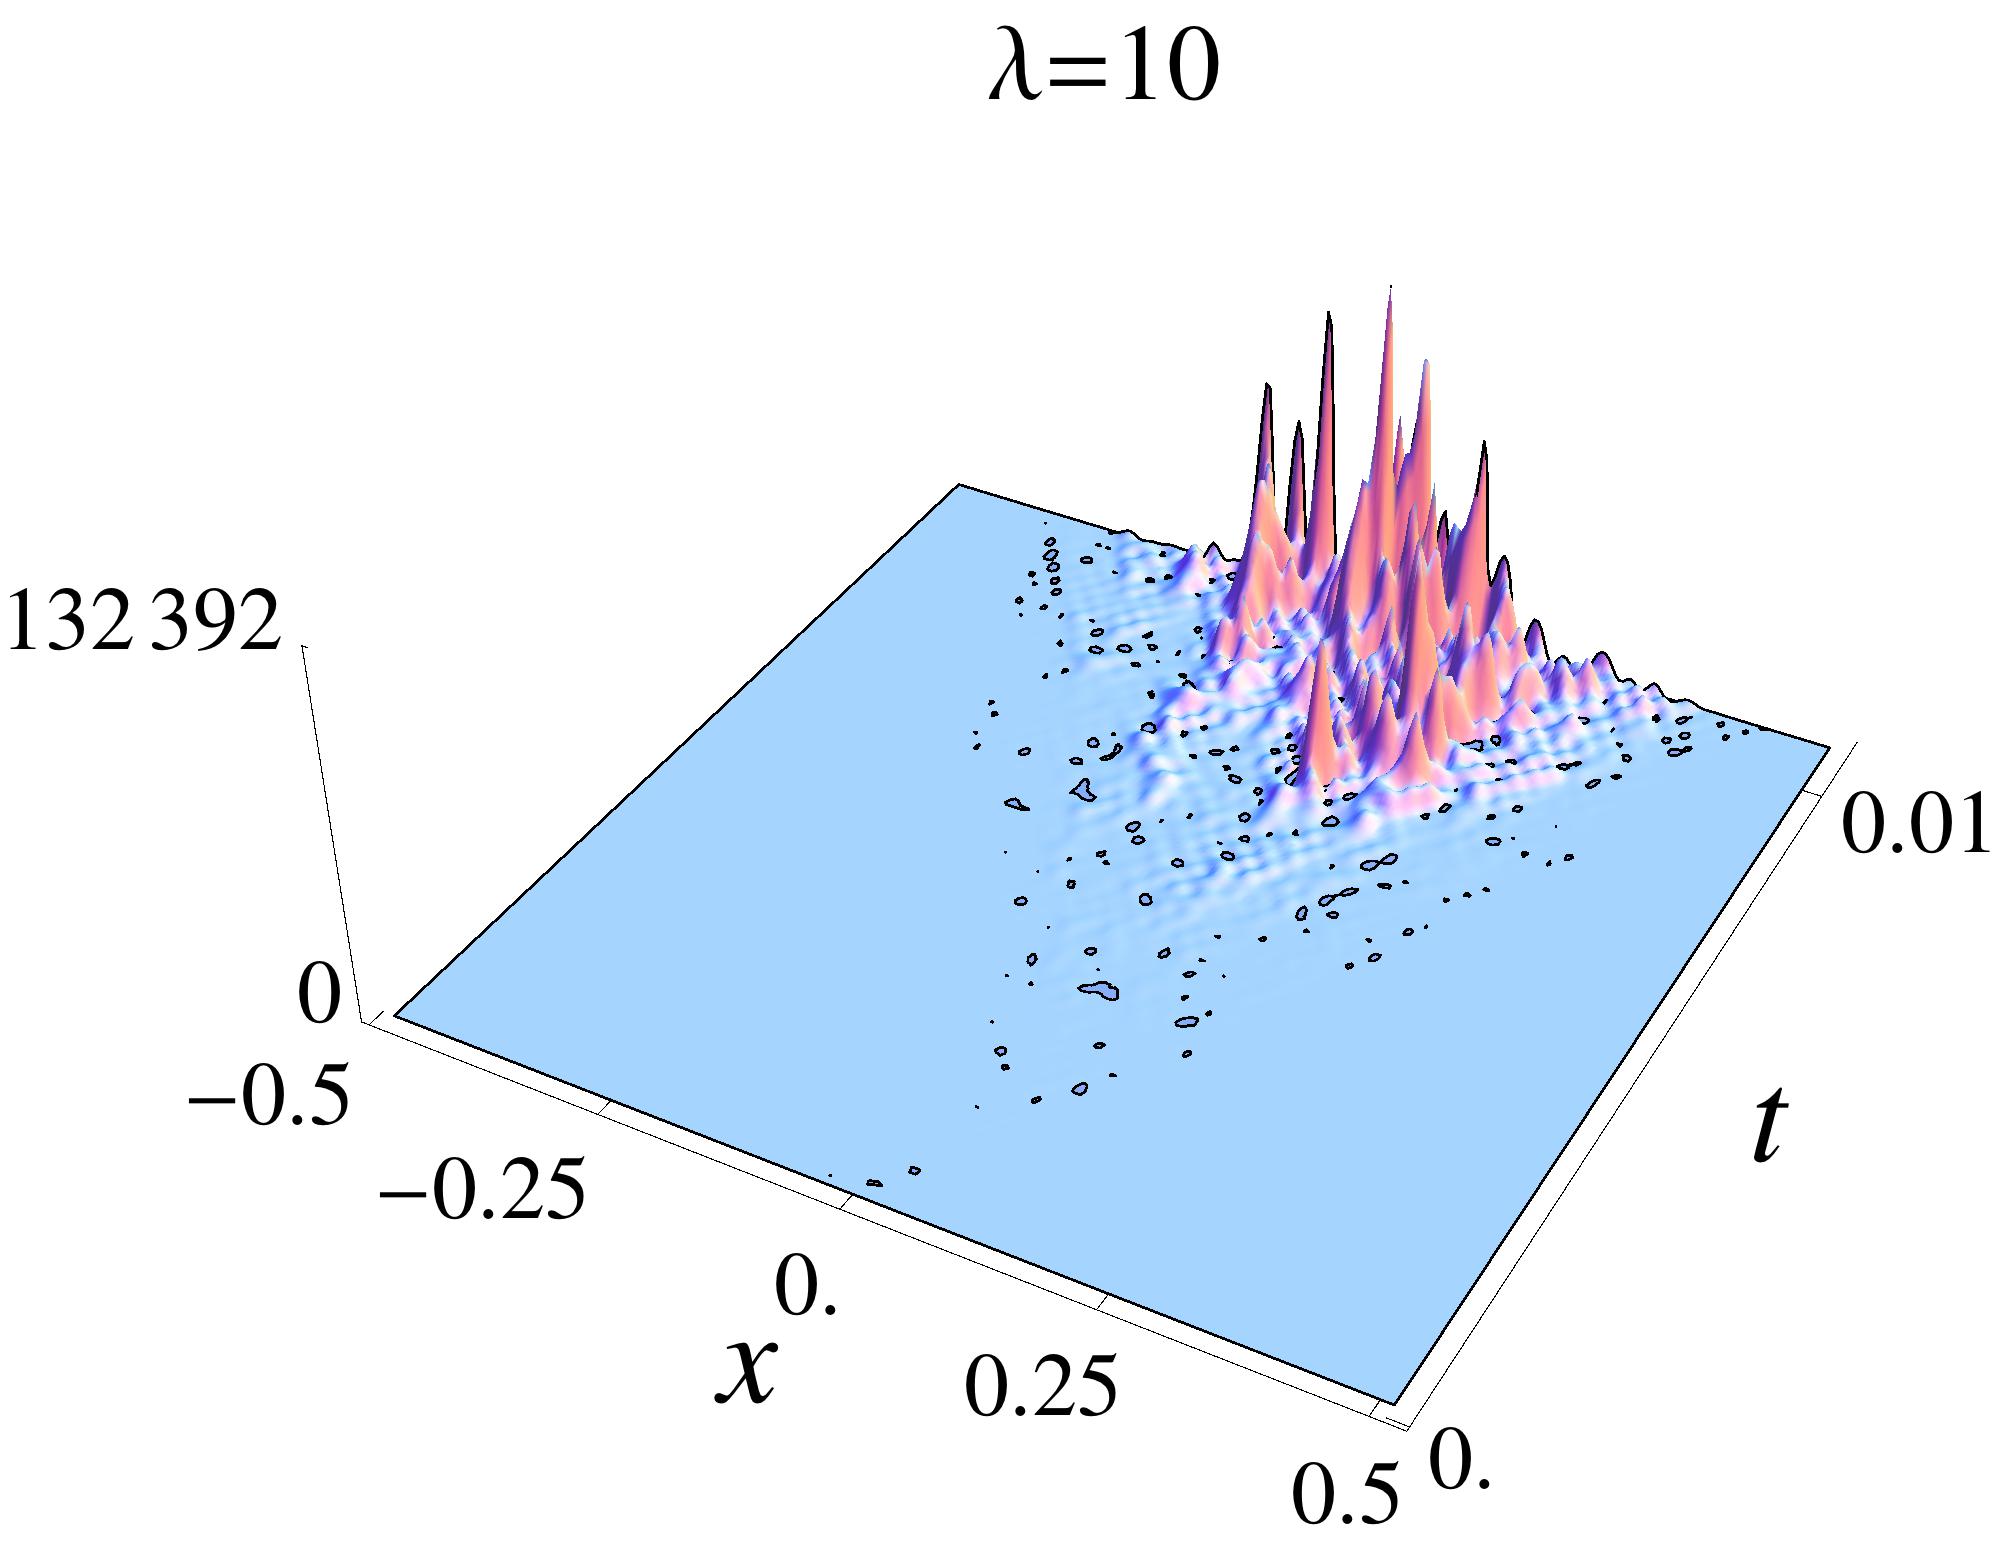 Lambda = 10
Cut Images (Height = 500)
JPEG Previews:
 Lambda = 0 (Cut at Height 500)
 Lambda = 1 (Cut at Height 500)
 Lambda = 2 (Cut at Height 500)
 Lambda = 3 (Cut at Height 500)
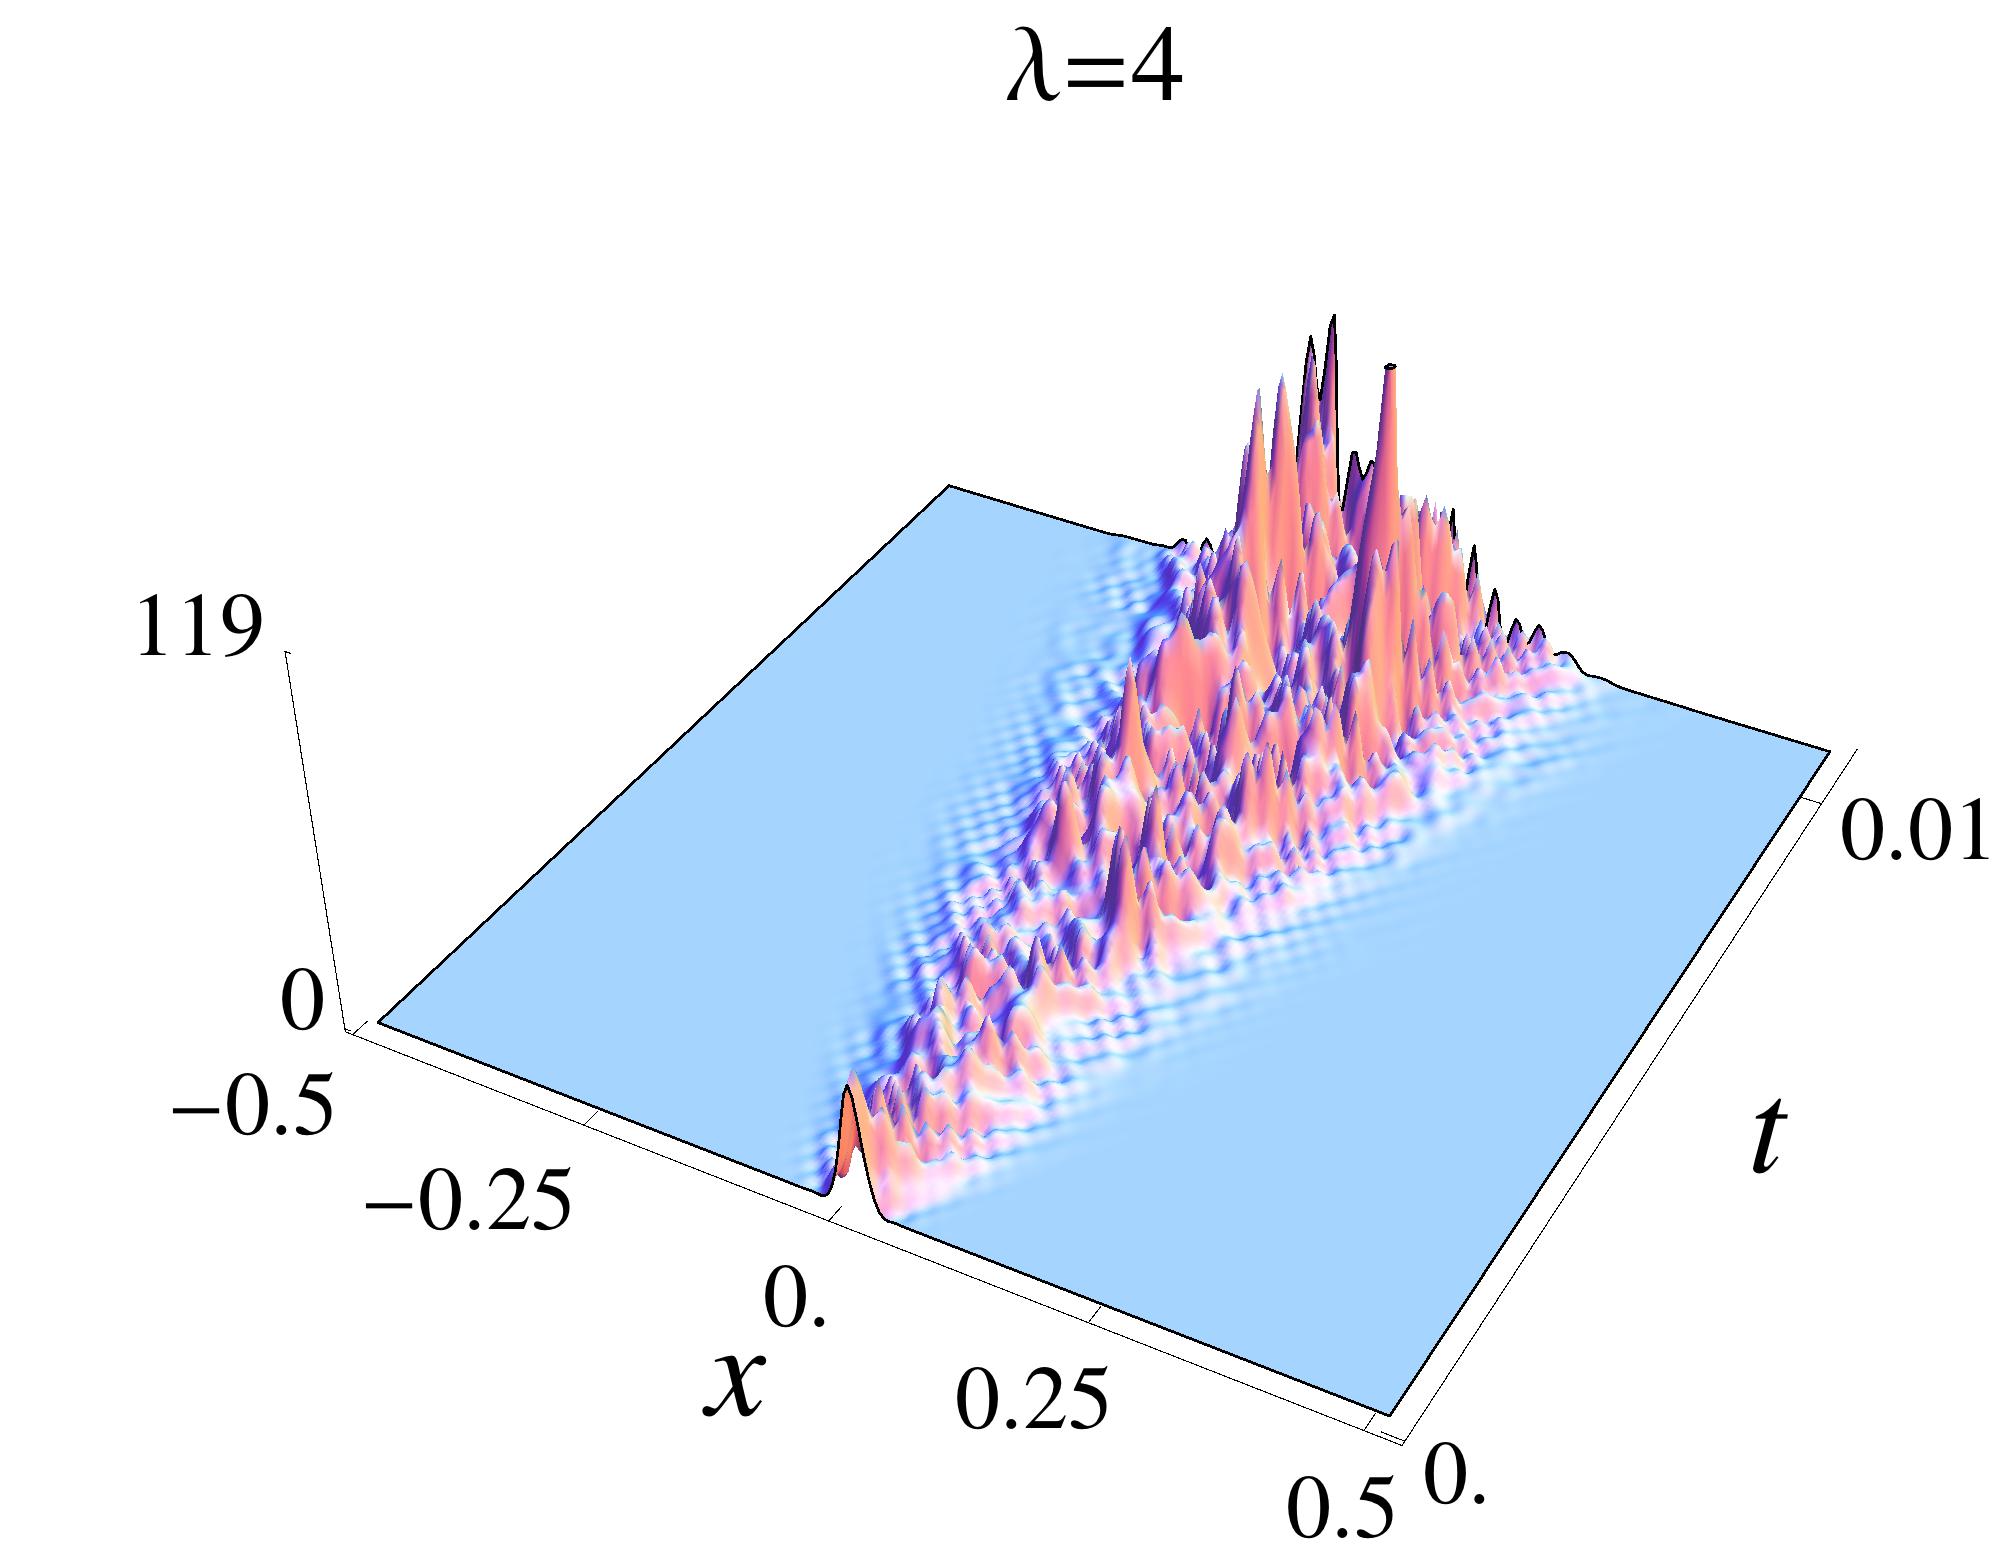 Lambda = 4 (Cut at Height 500)
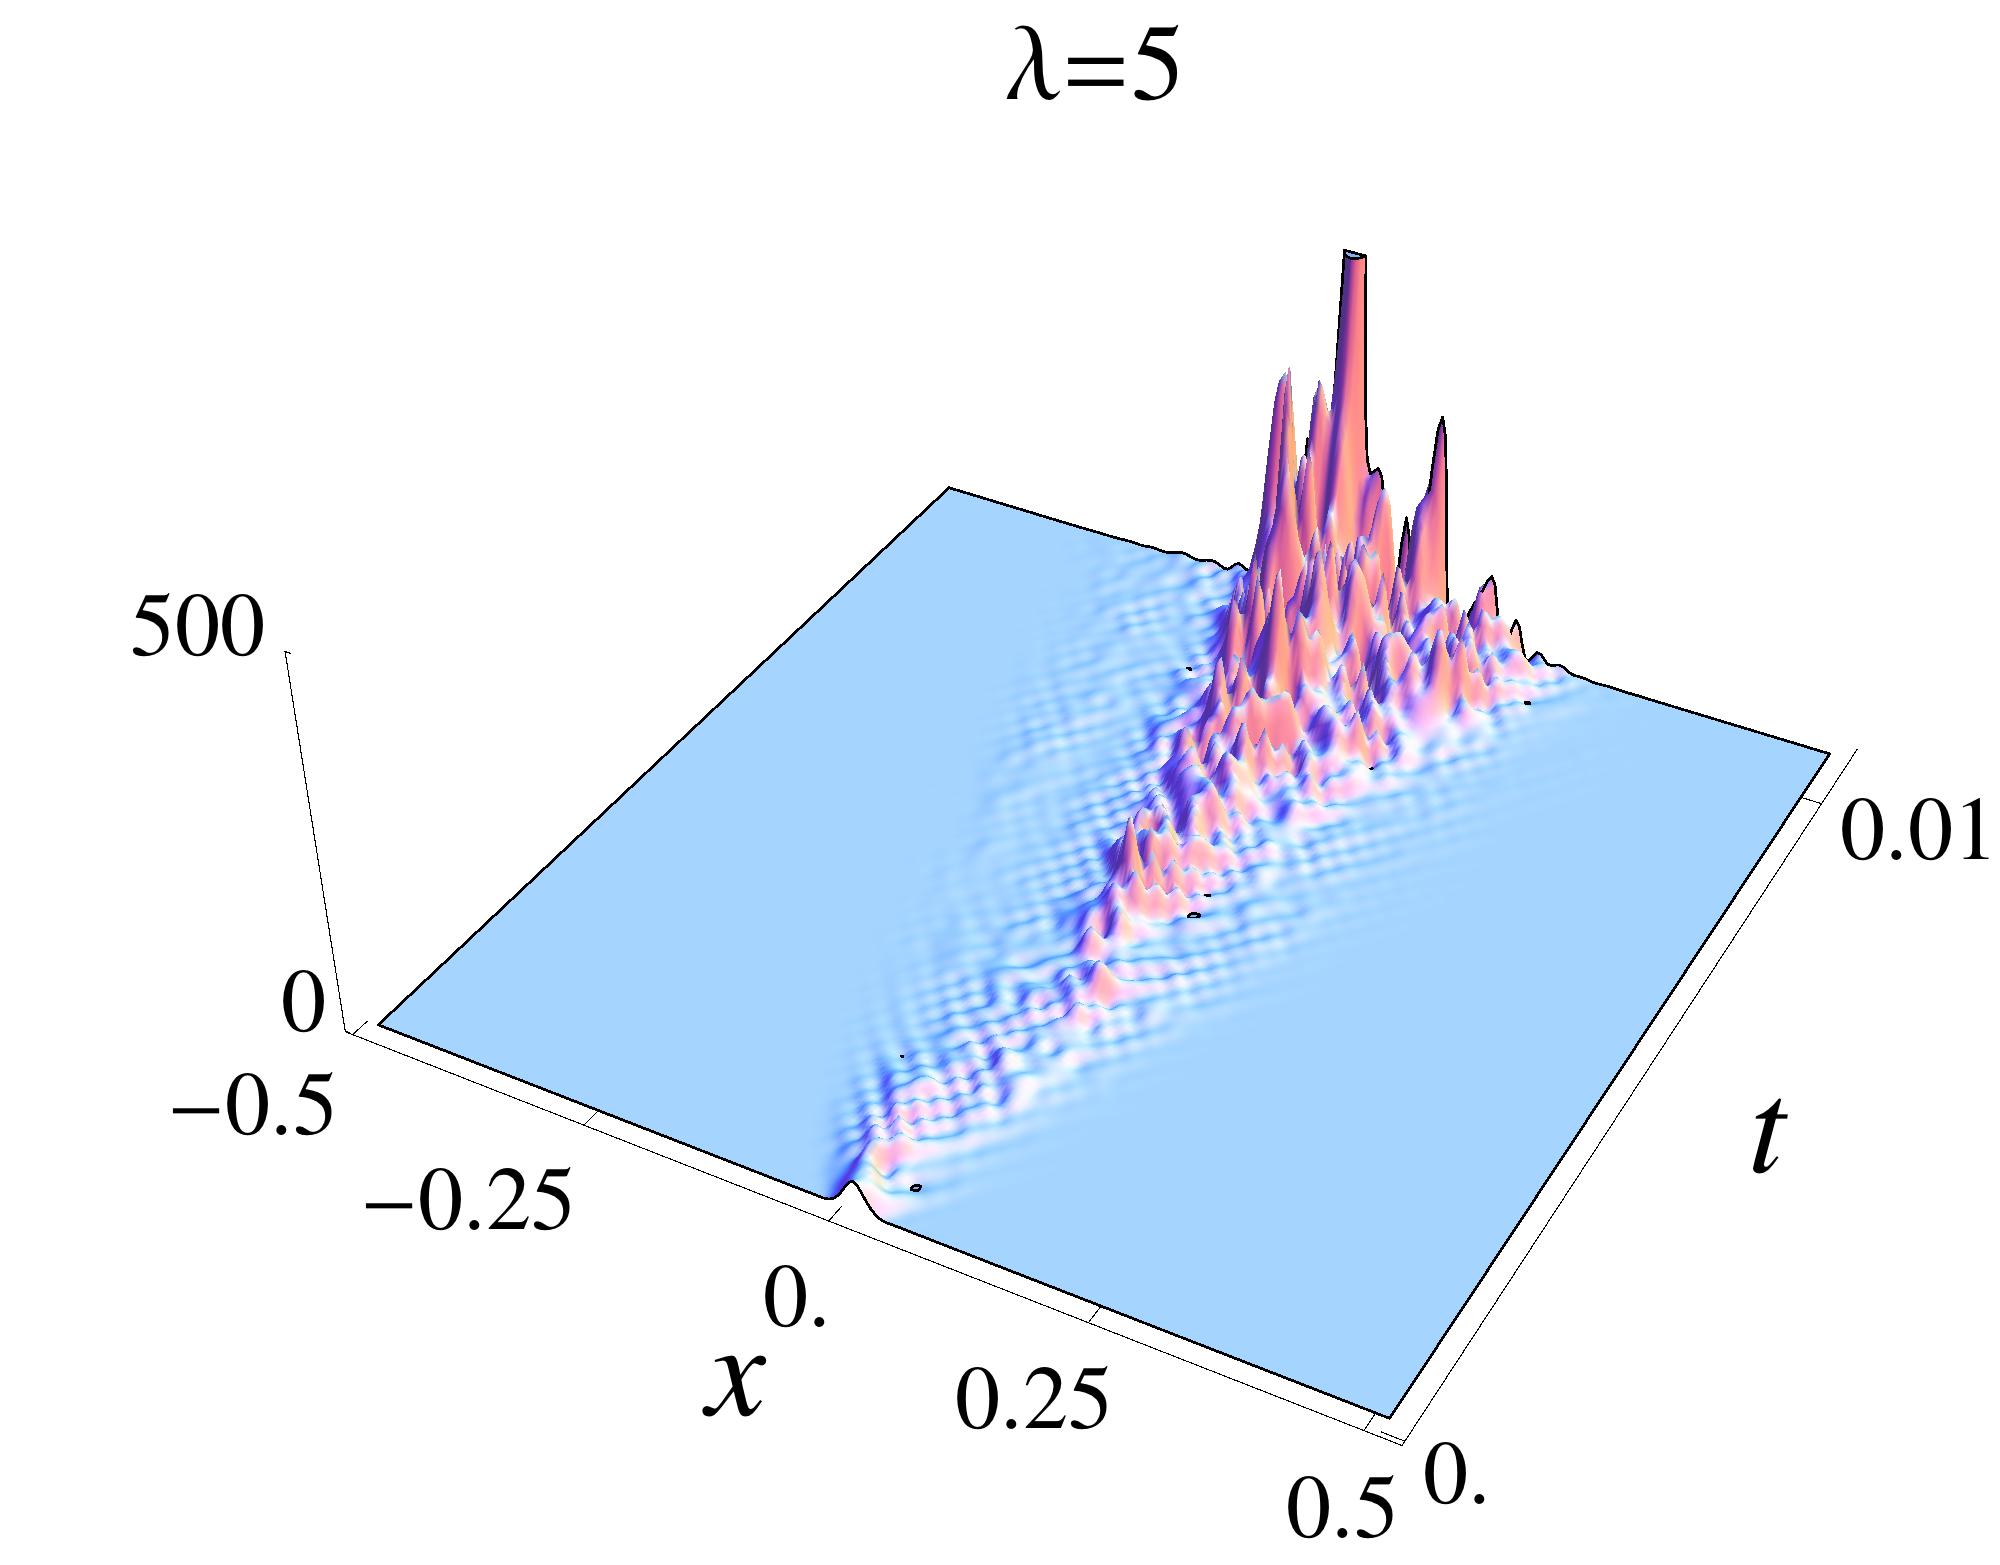 Lambda = 5 (Cut at Height 500)
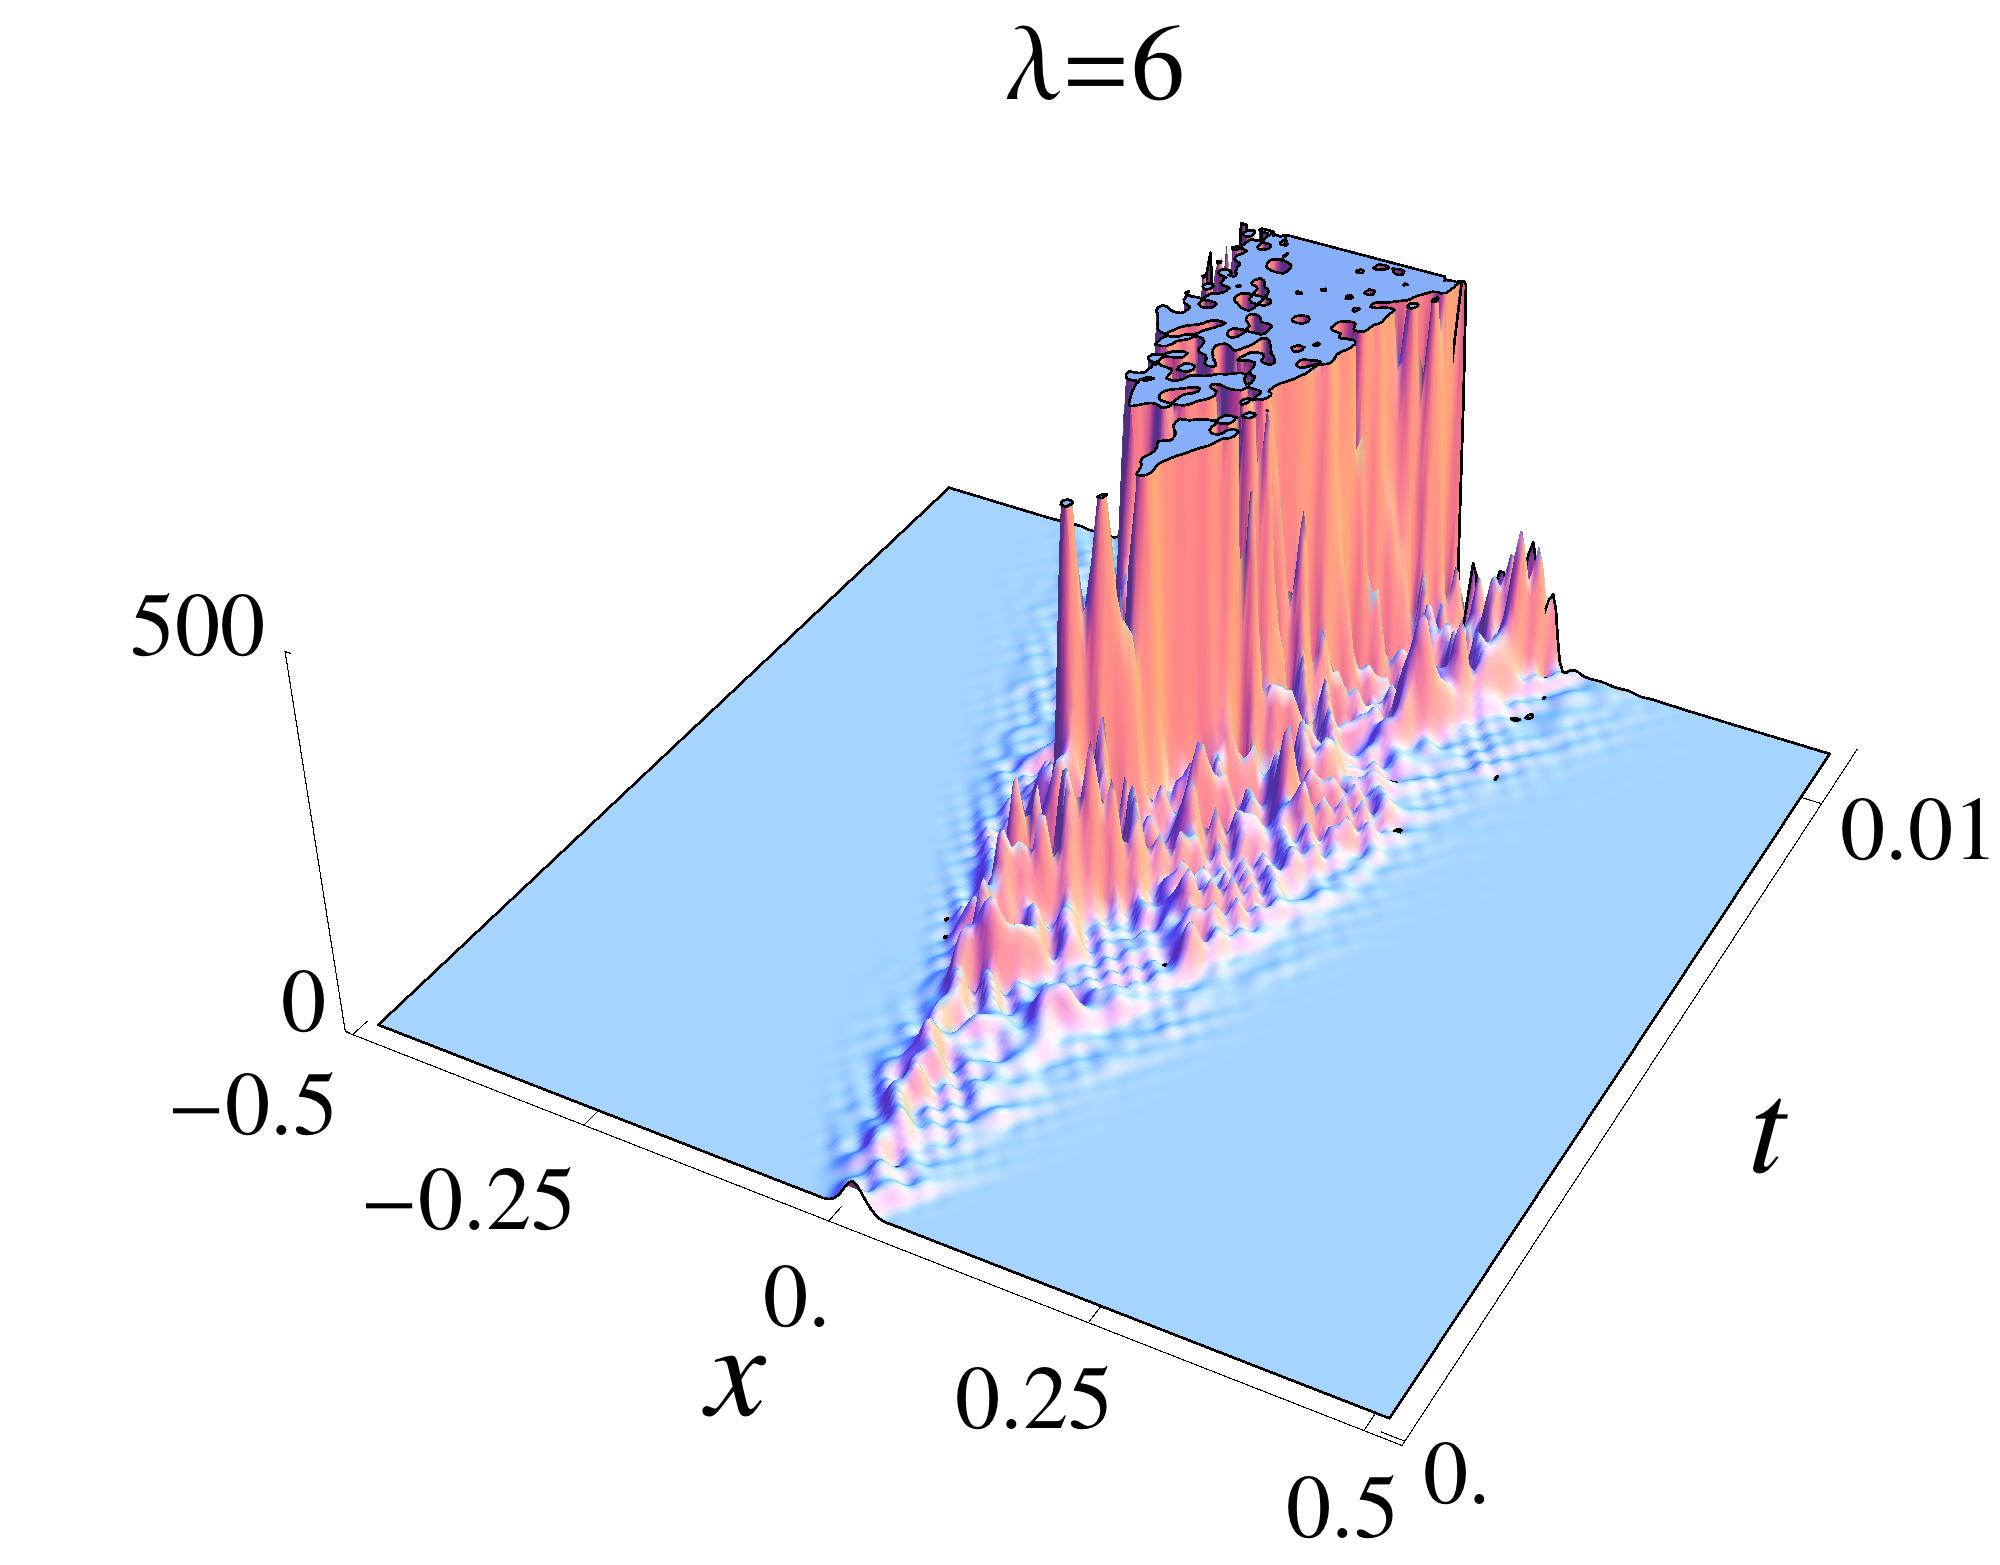 Lambda = 6 (Cut at Height 500)
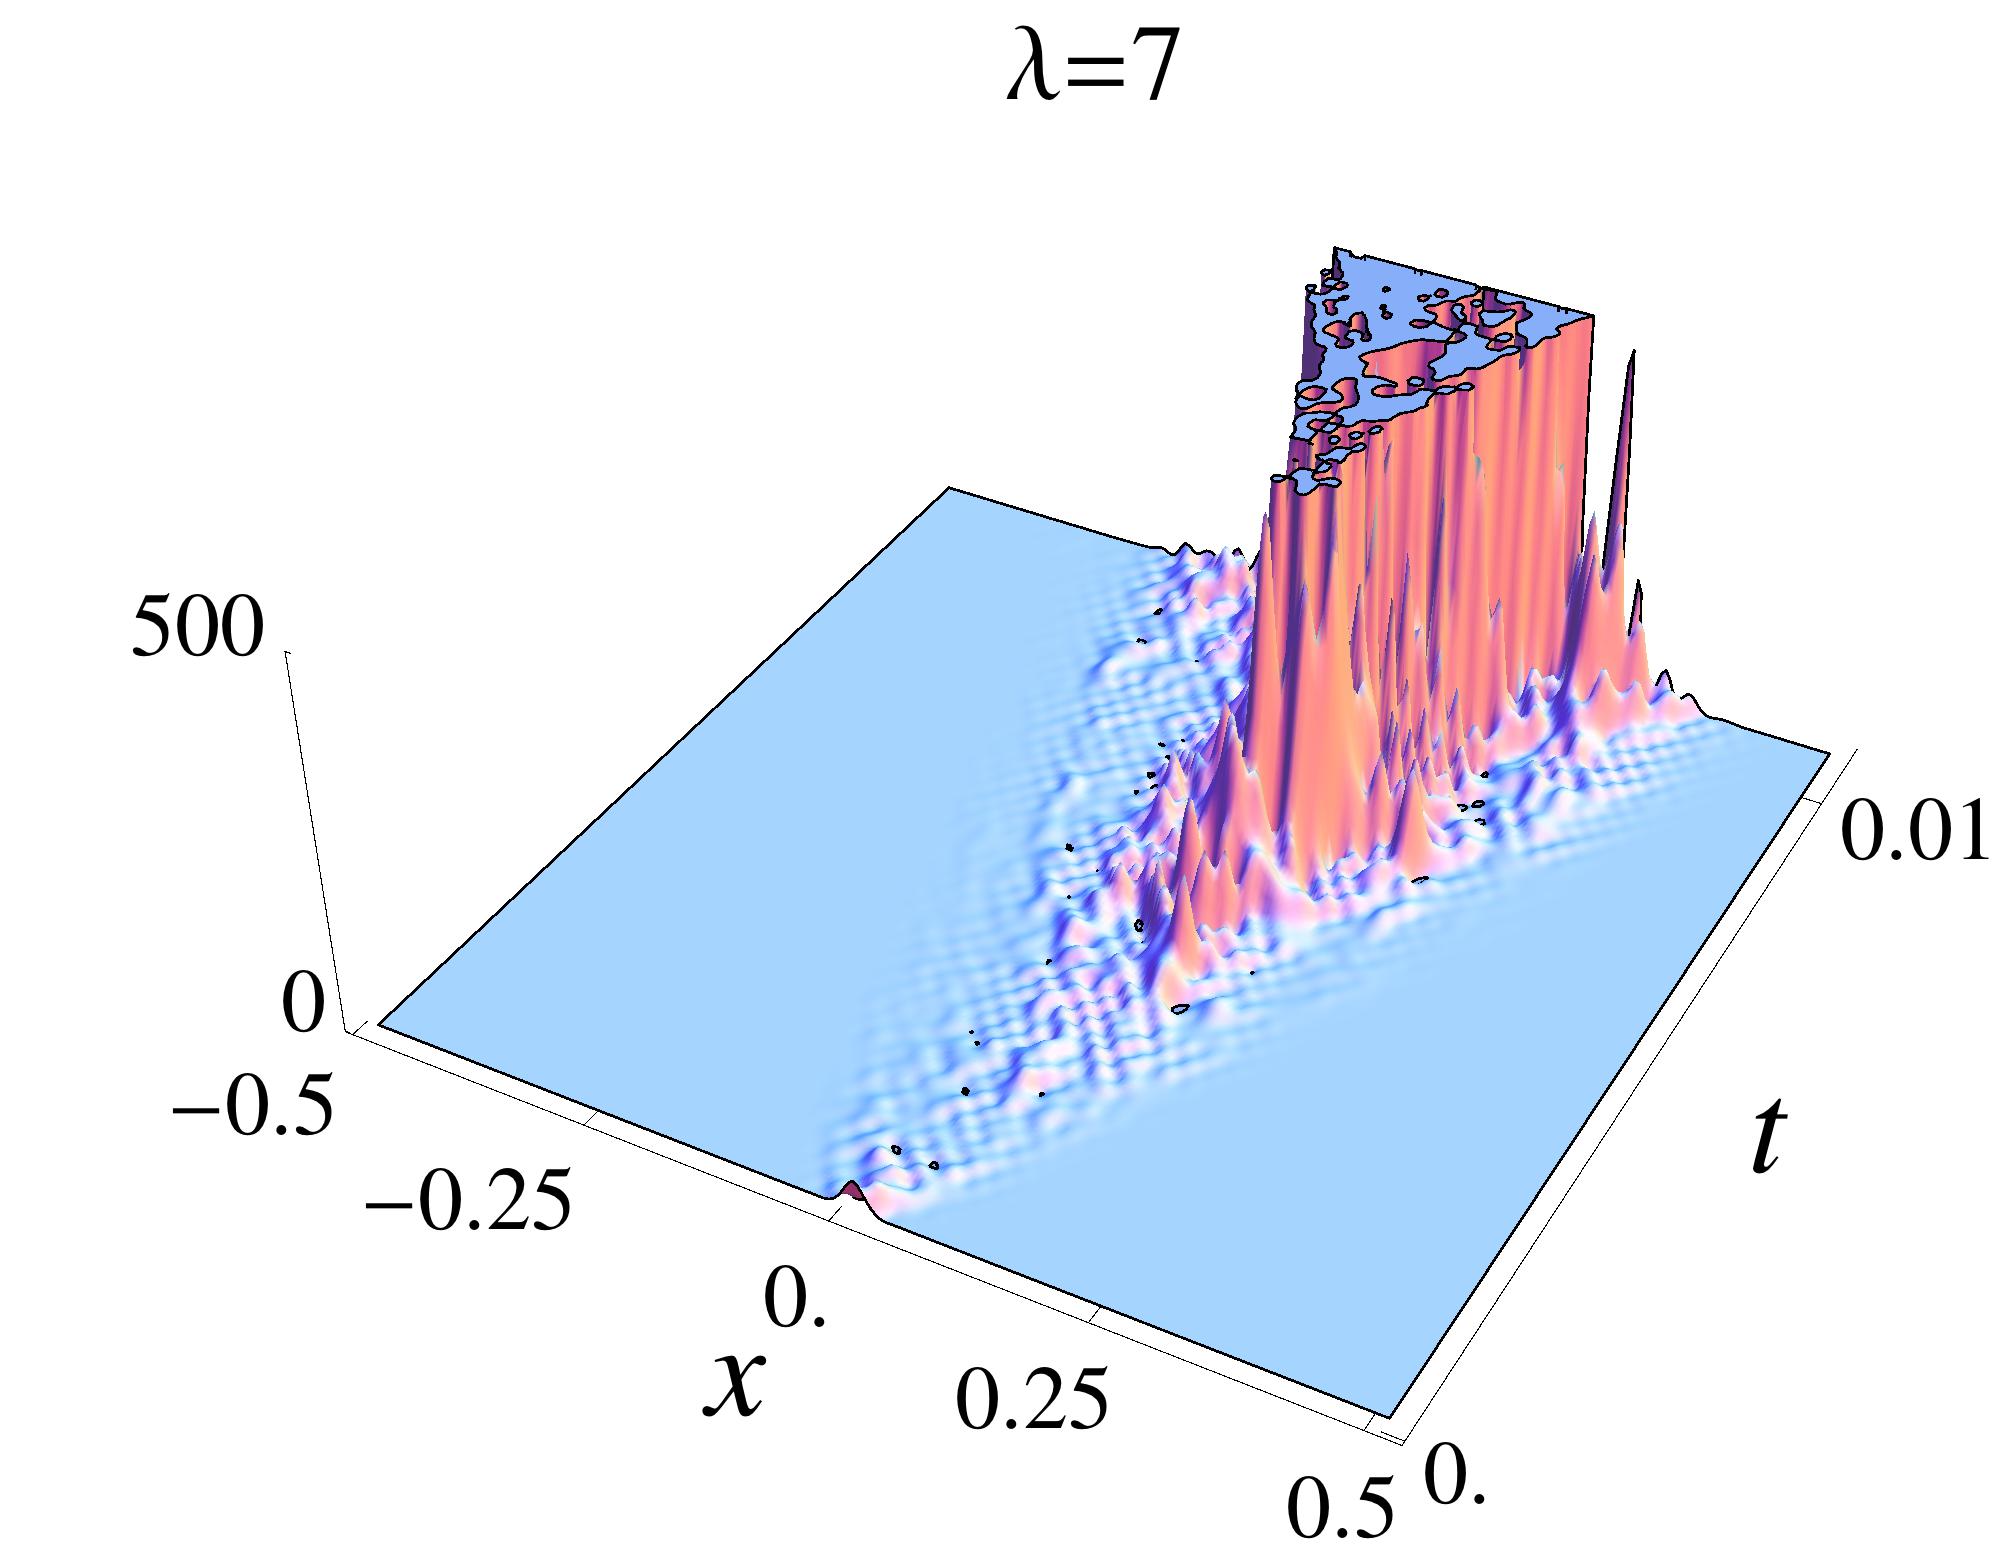 Lambda = 7 (Cut at Height 500)
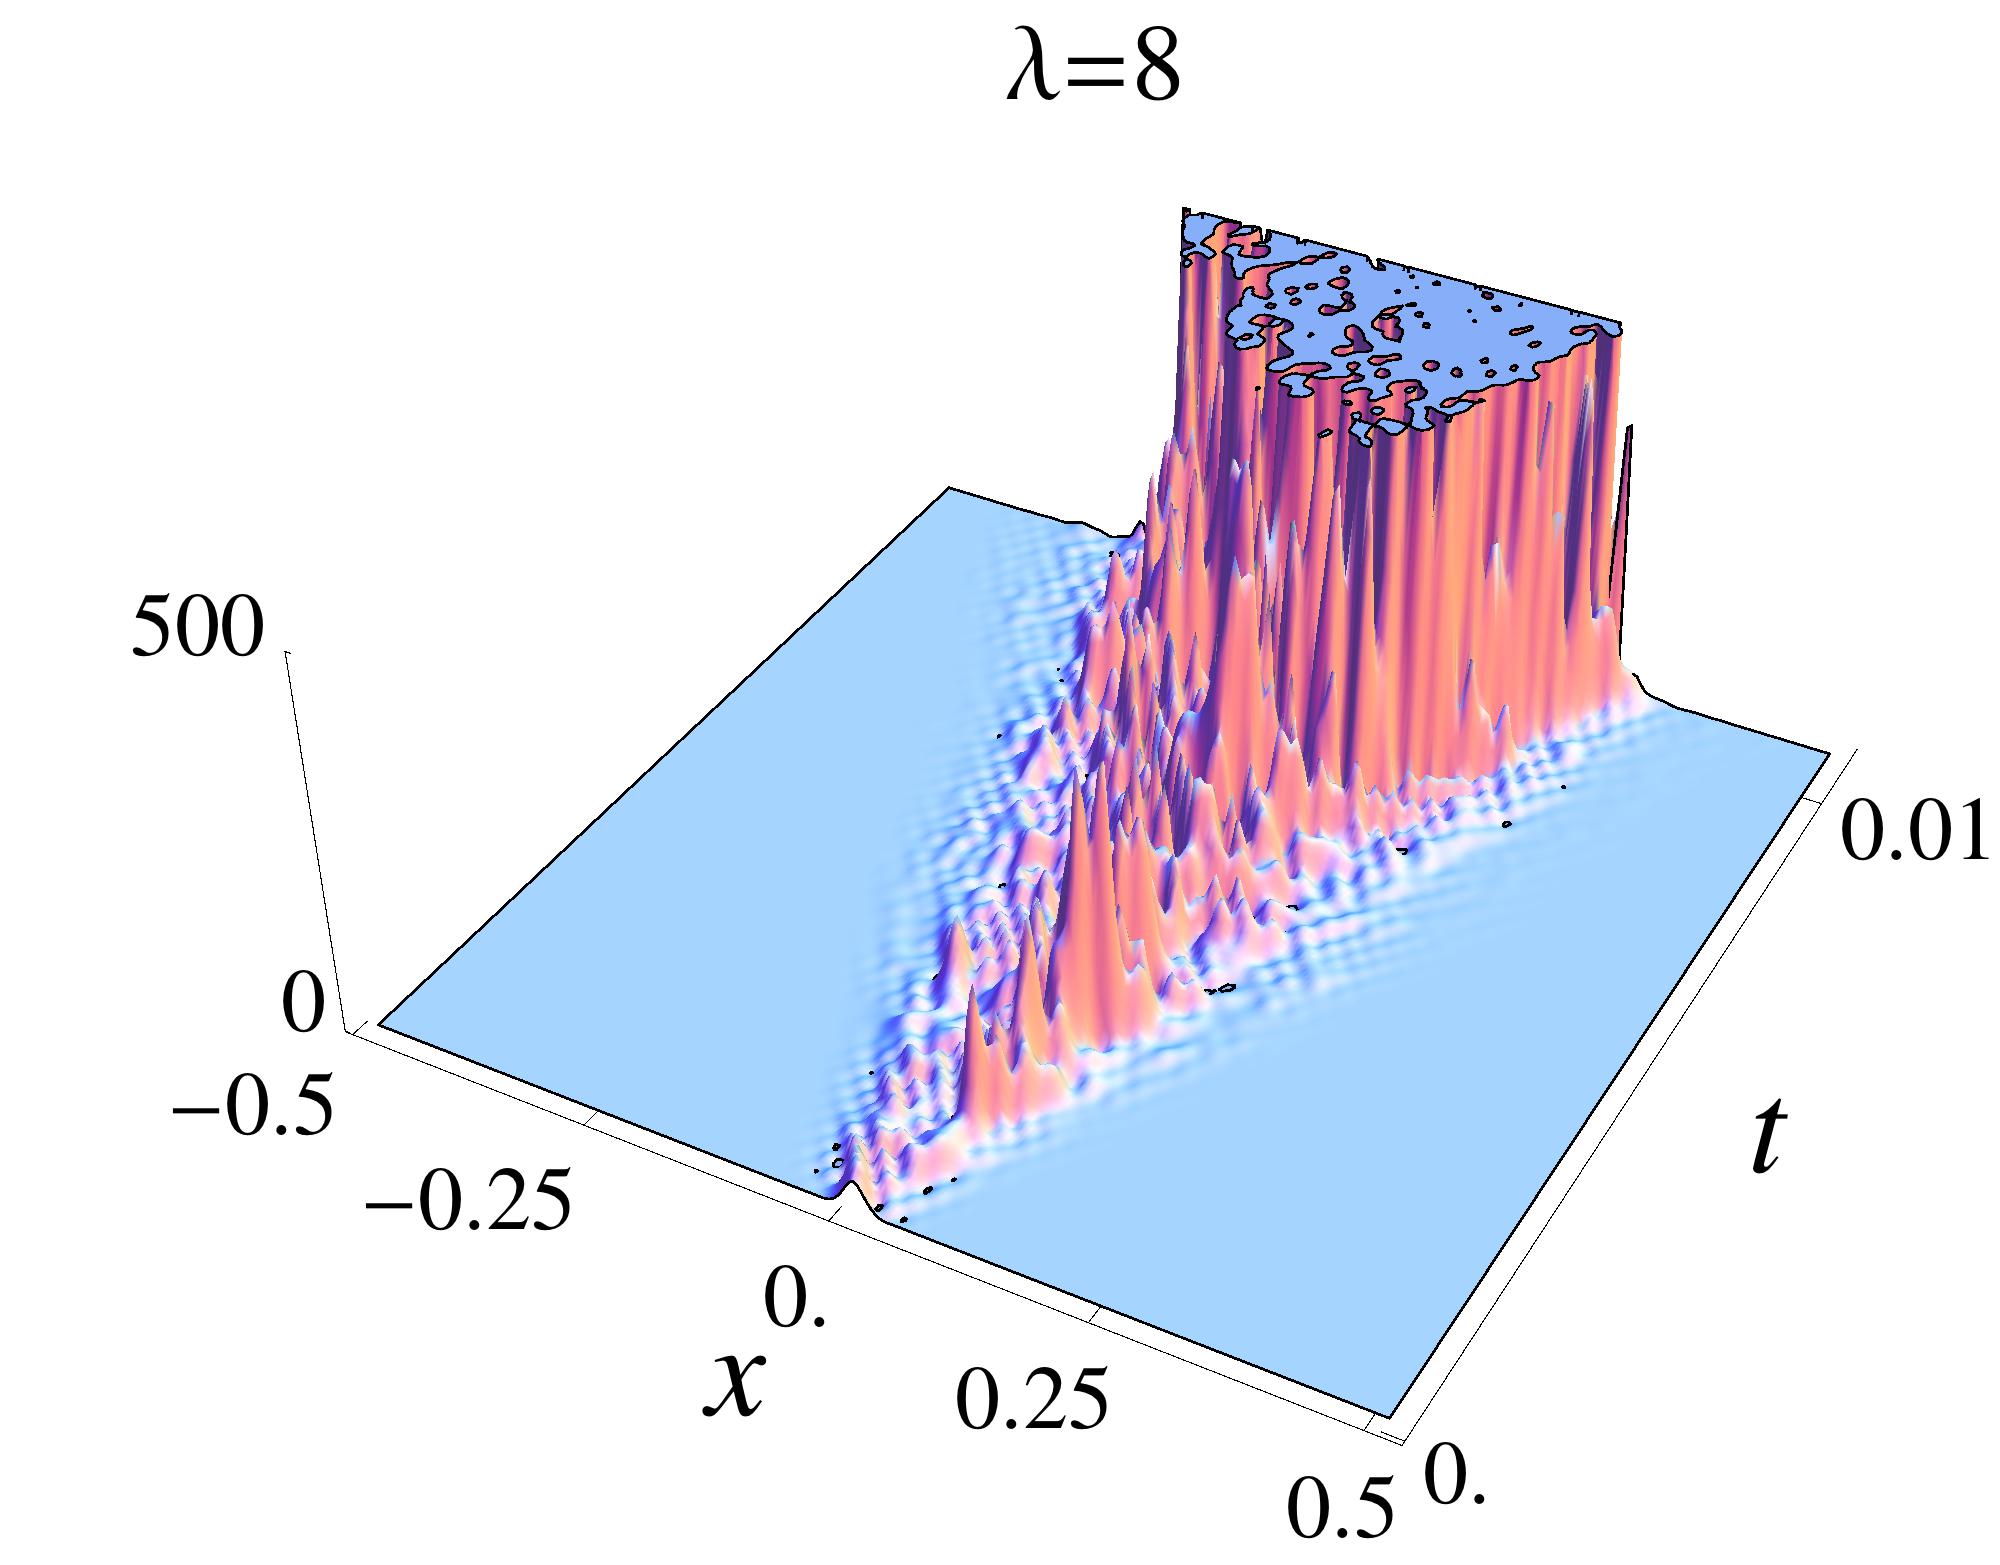 Lambda = 8 (Cut at Height 500)
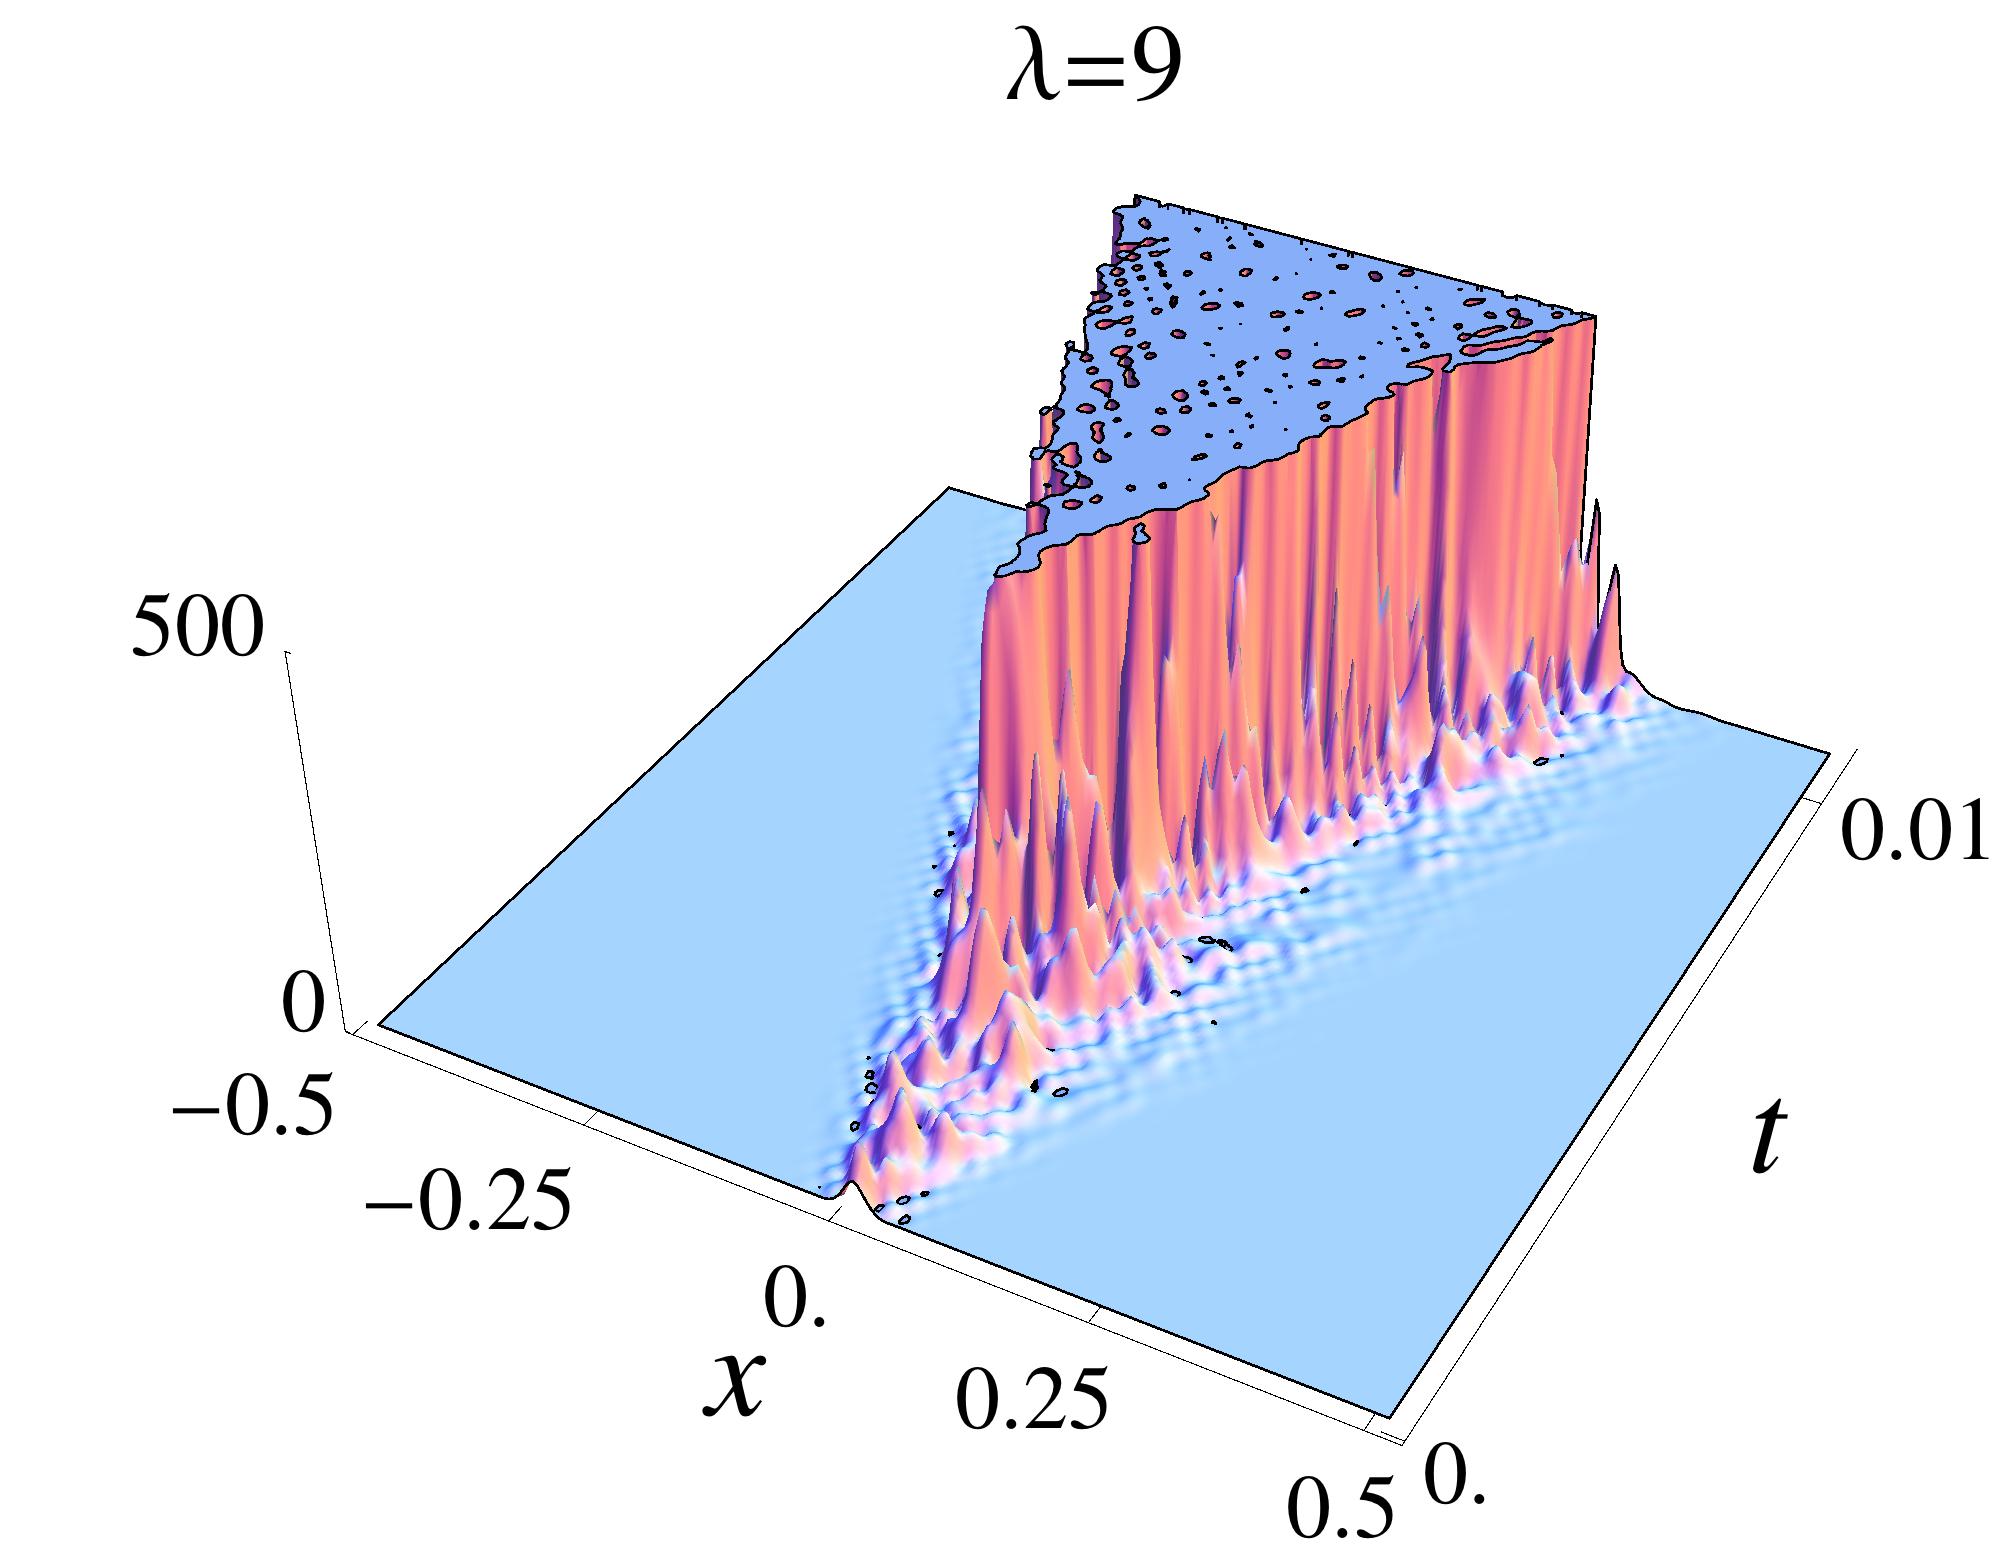 Lambda = 9 (Cut at Height 500)
 Lambda = 10 (Cut at Height 500)
Neg (Dark Background)
JPEG Previews:
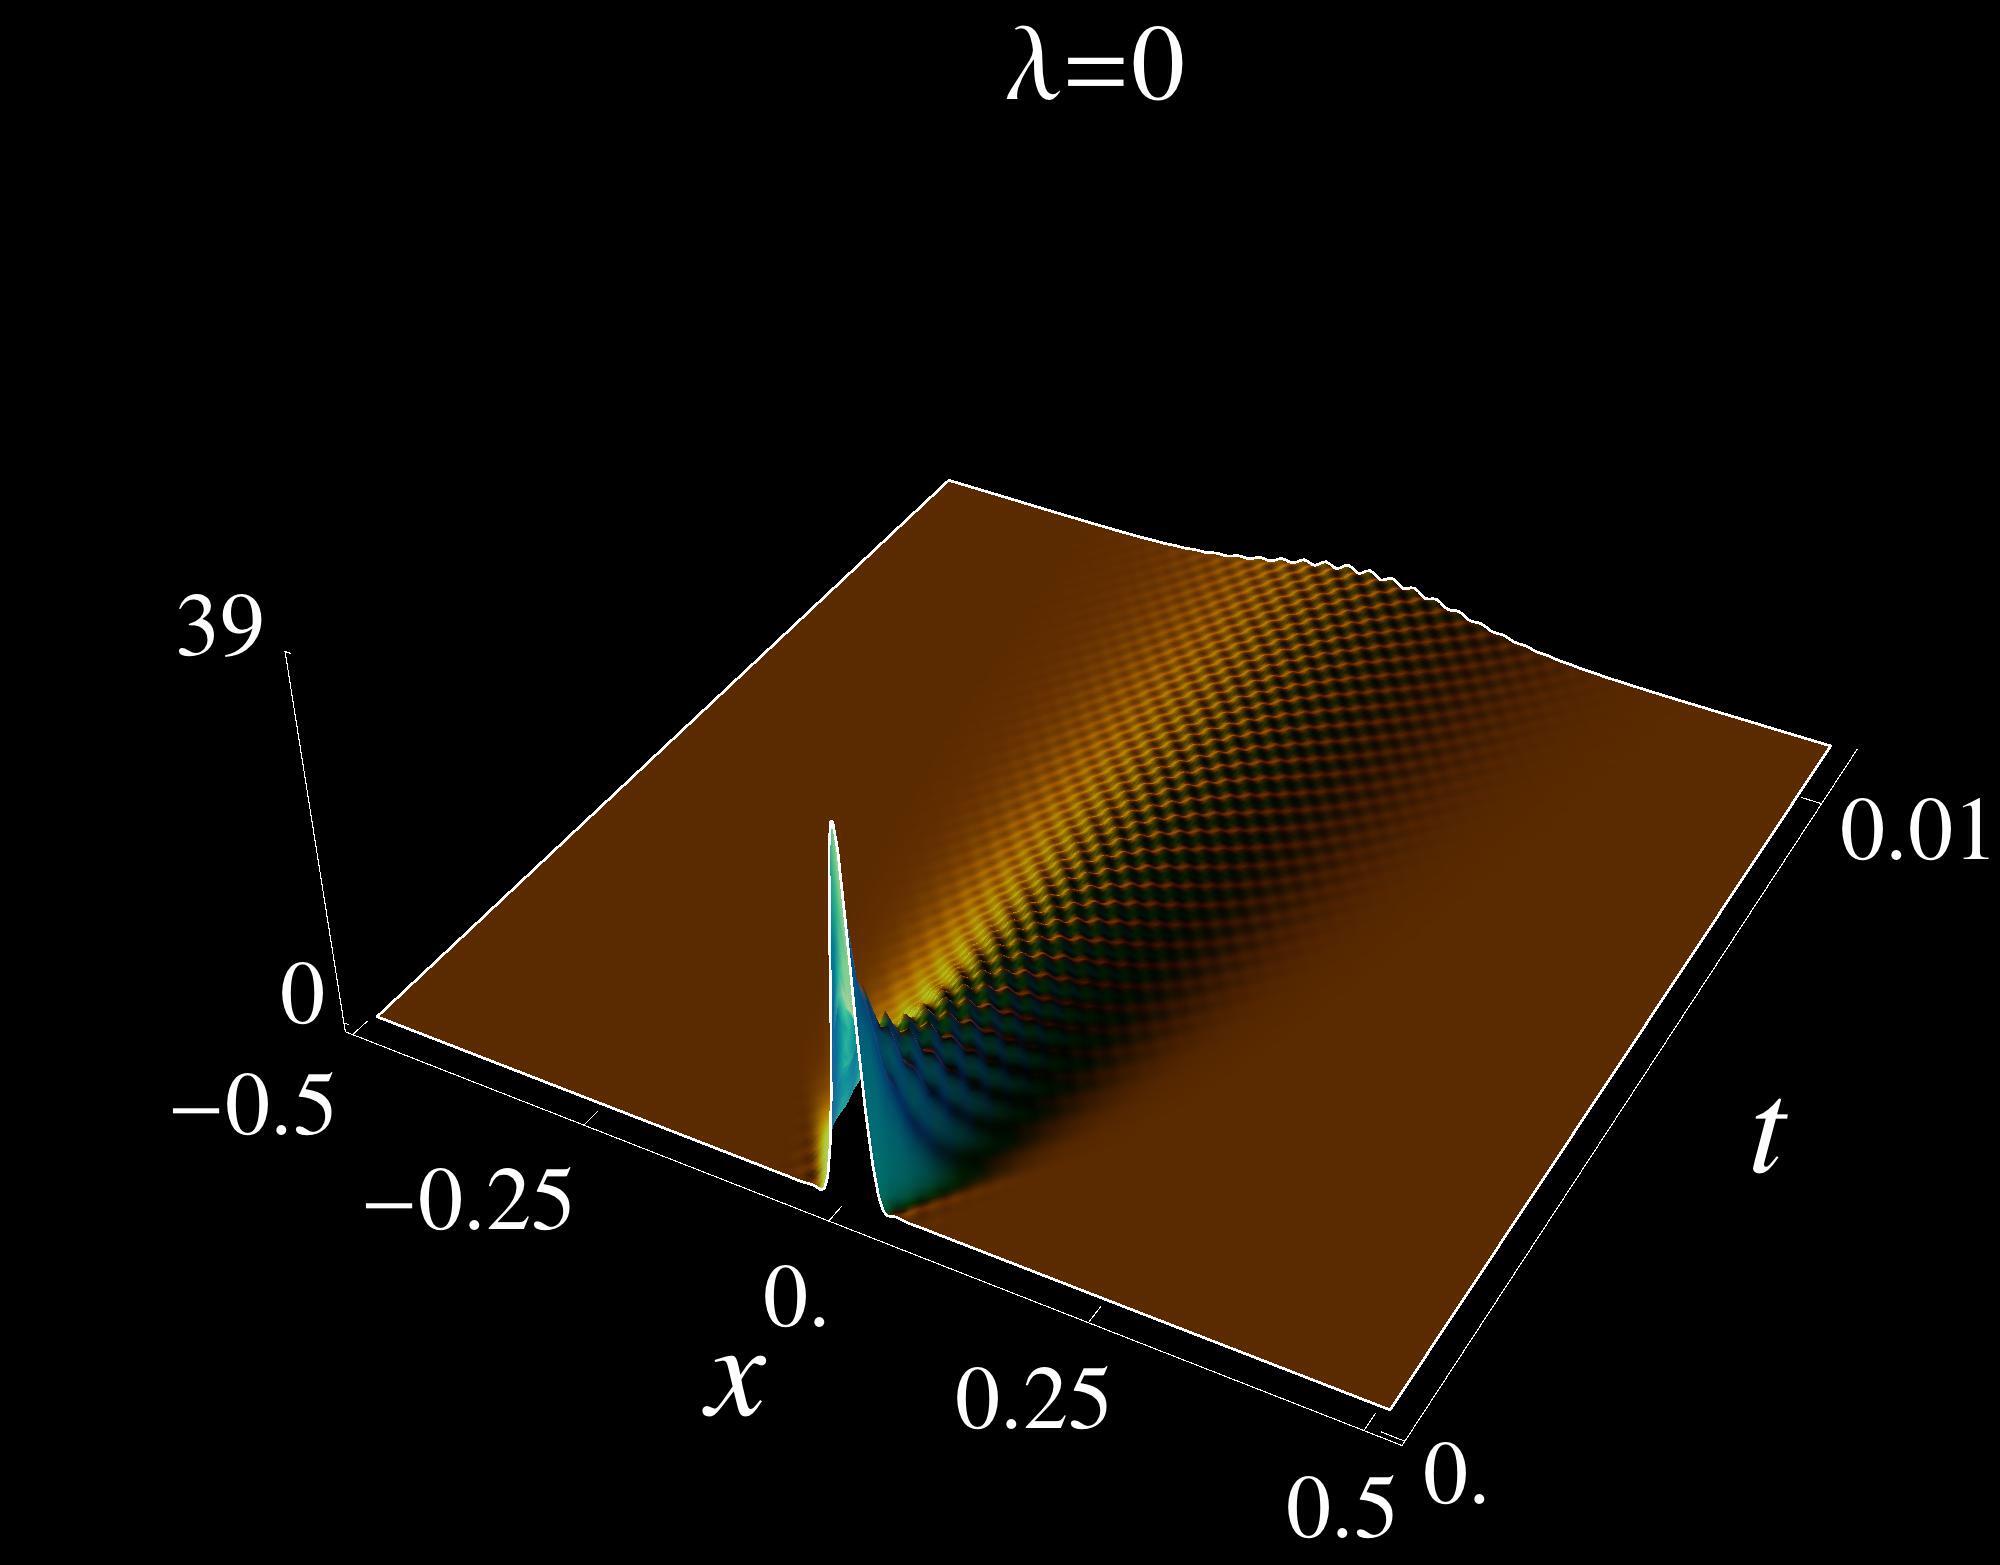 Lambda = 0 (Dark Background)
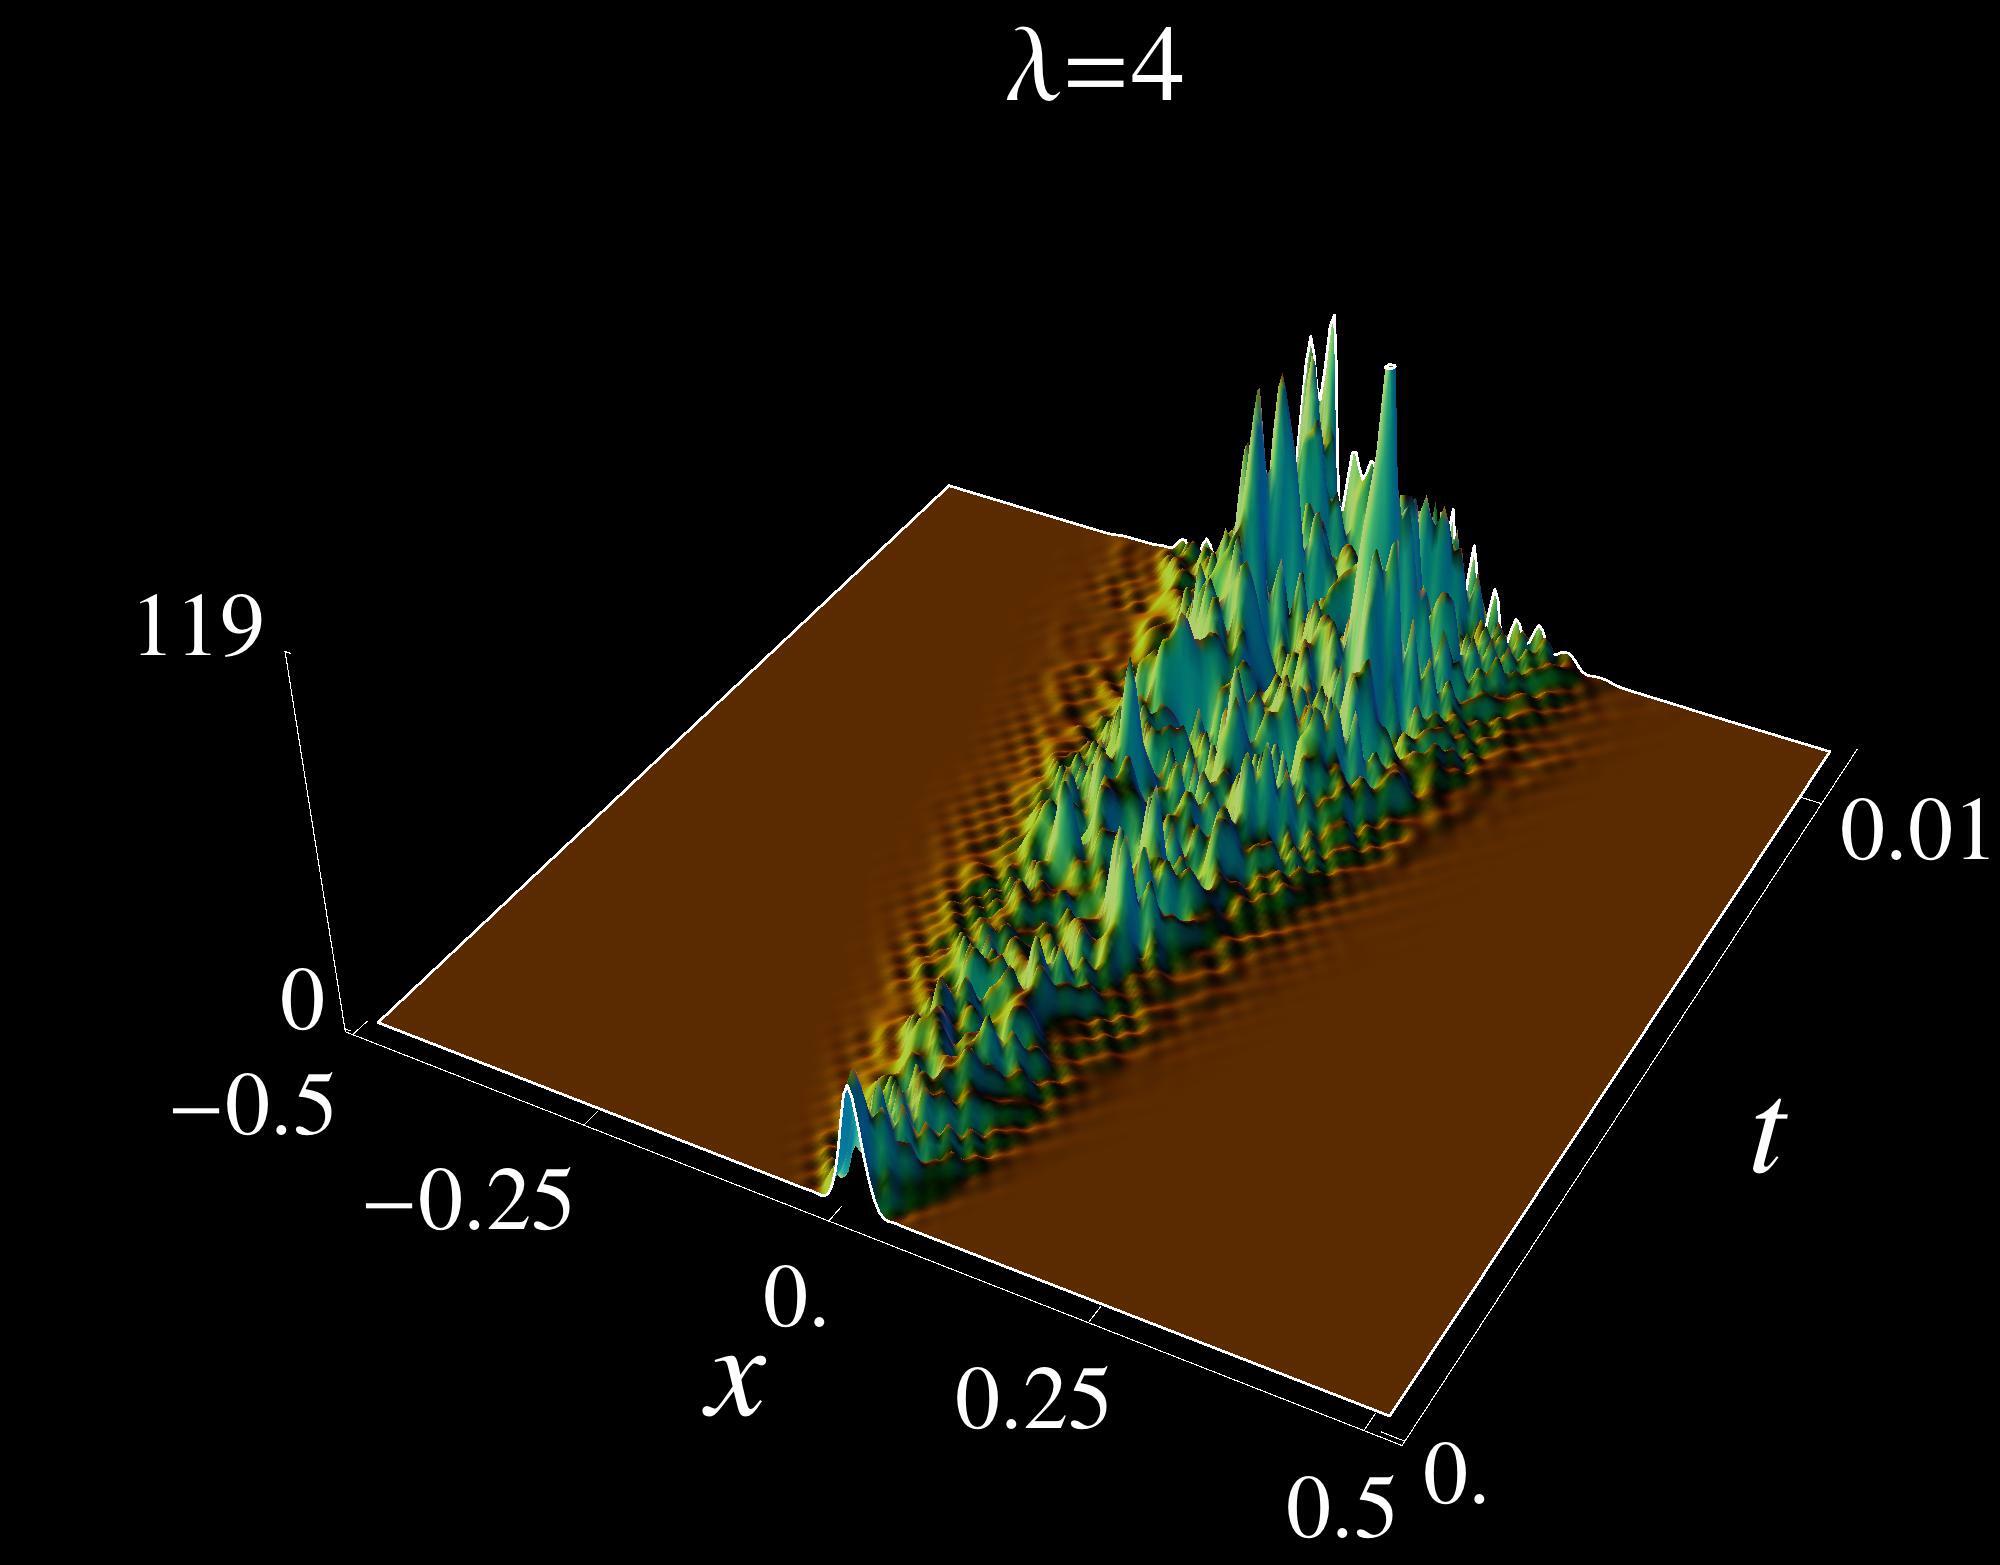 Lambda = 4 (Dark Background)
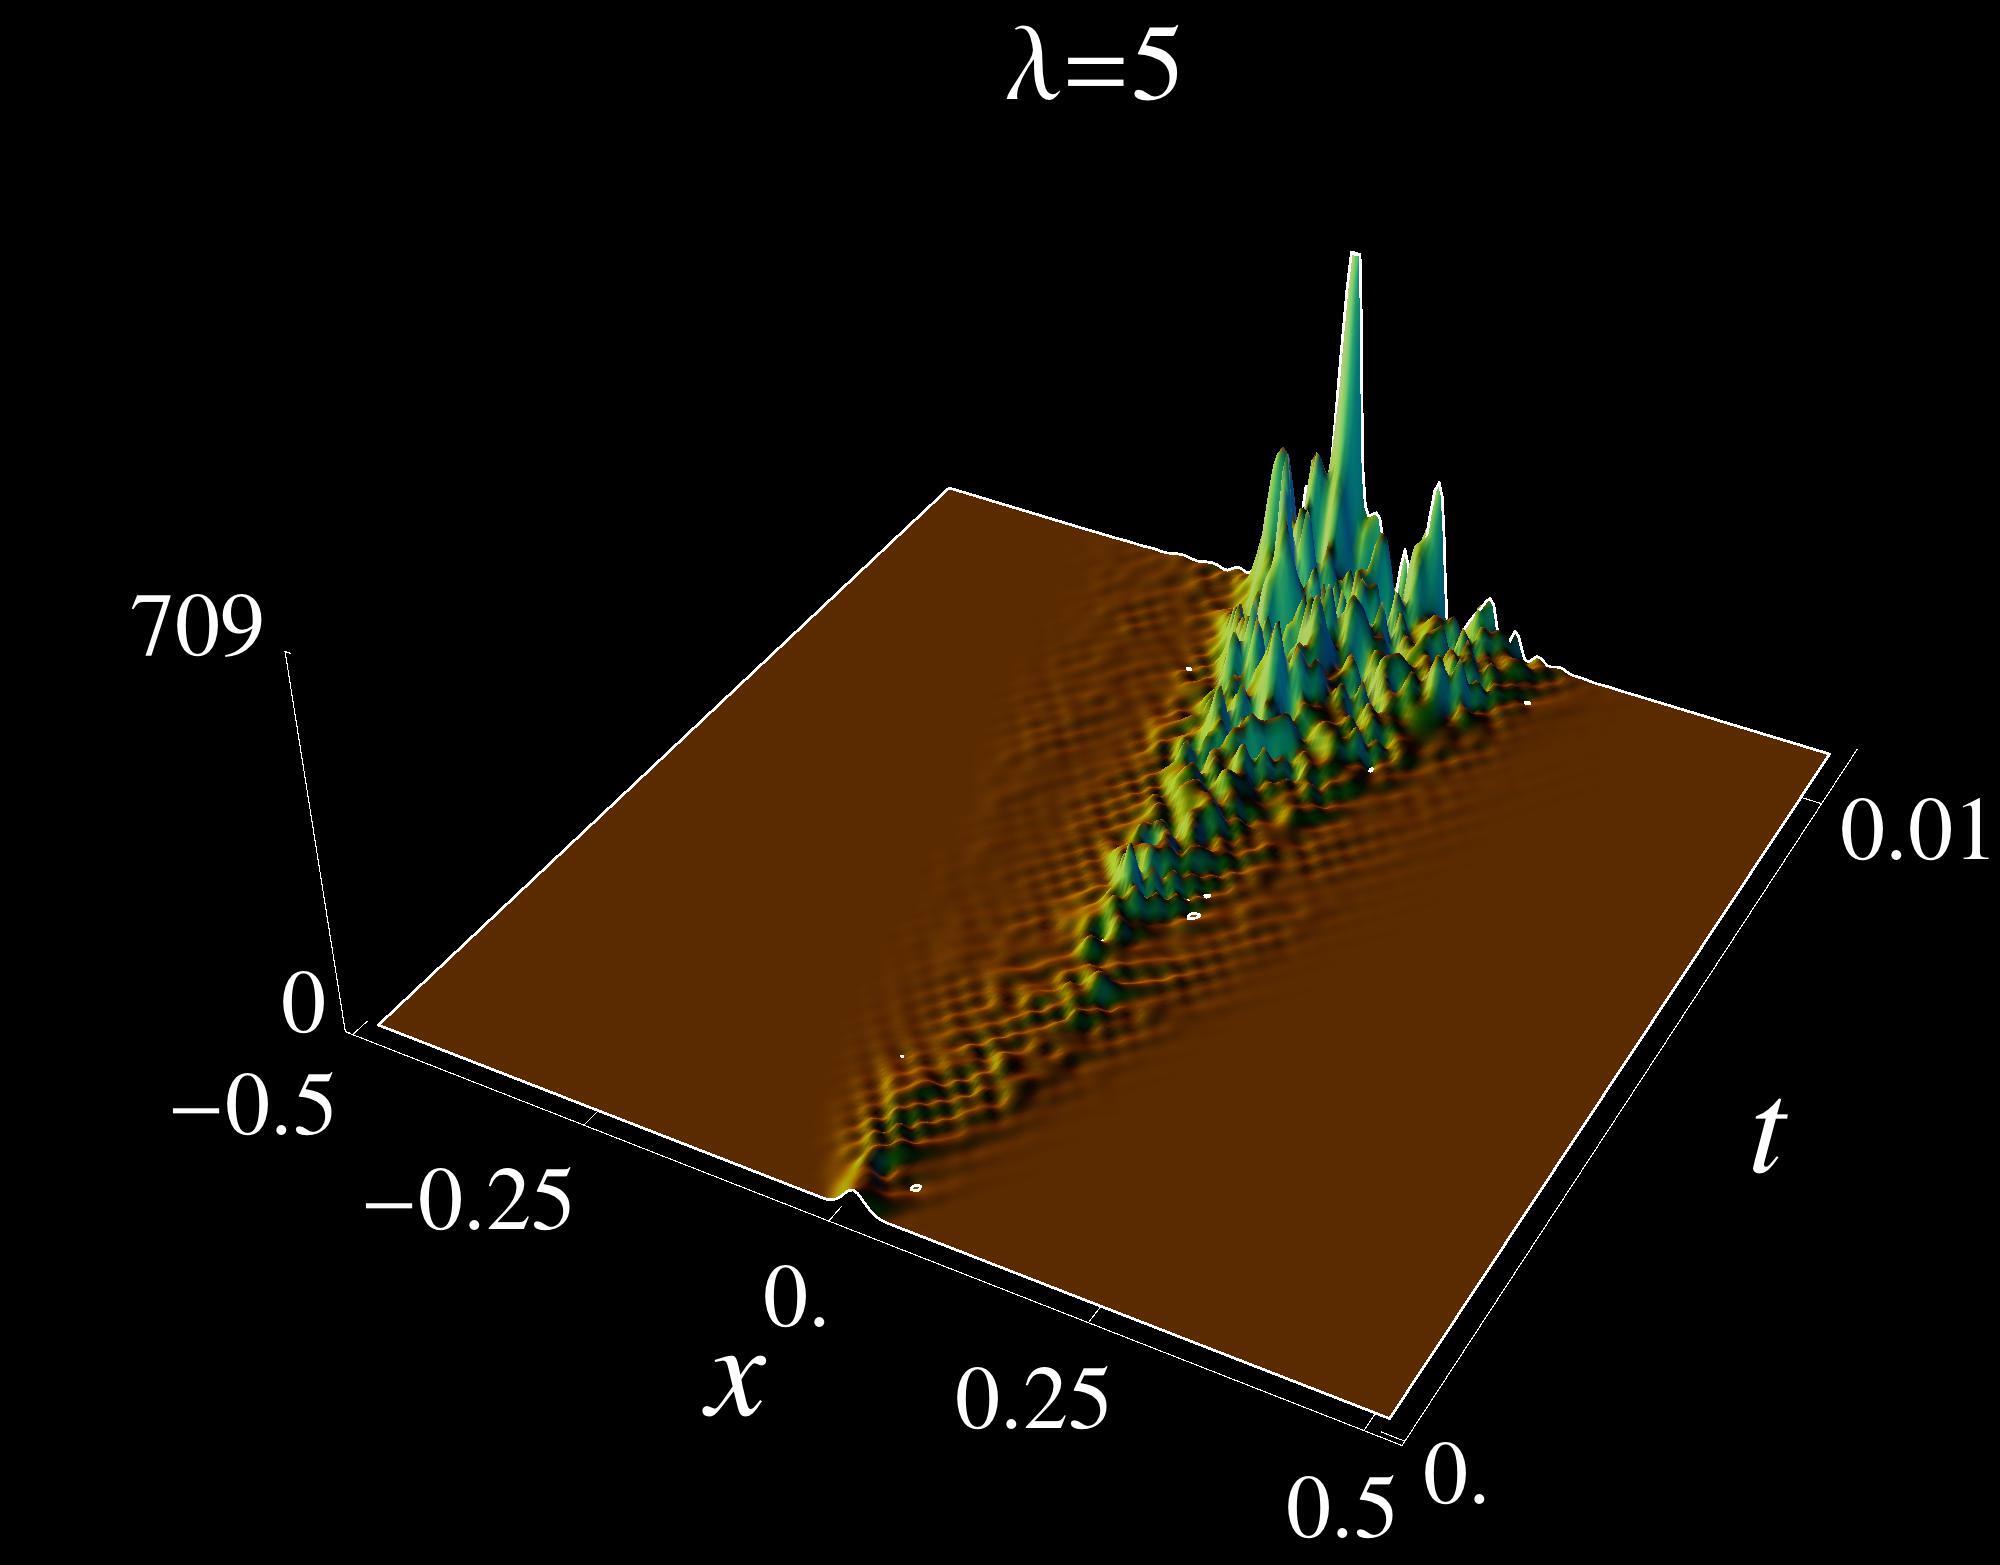 Lambda = 5 (Dark Background)
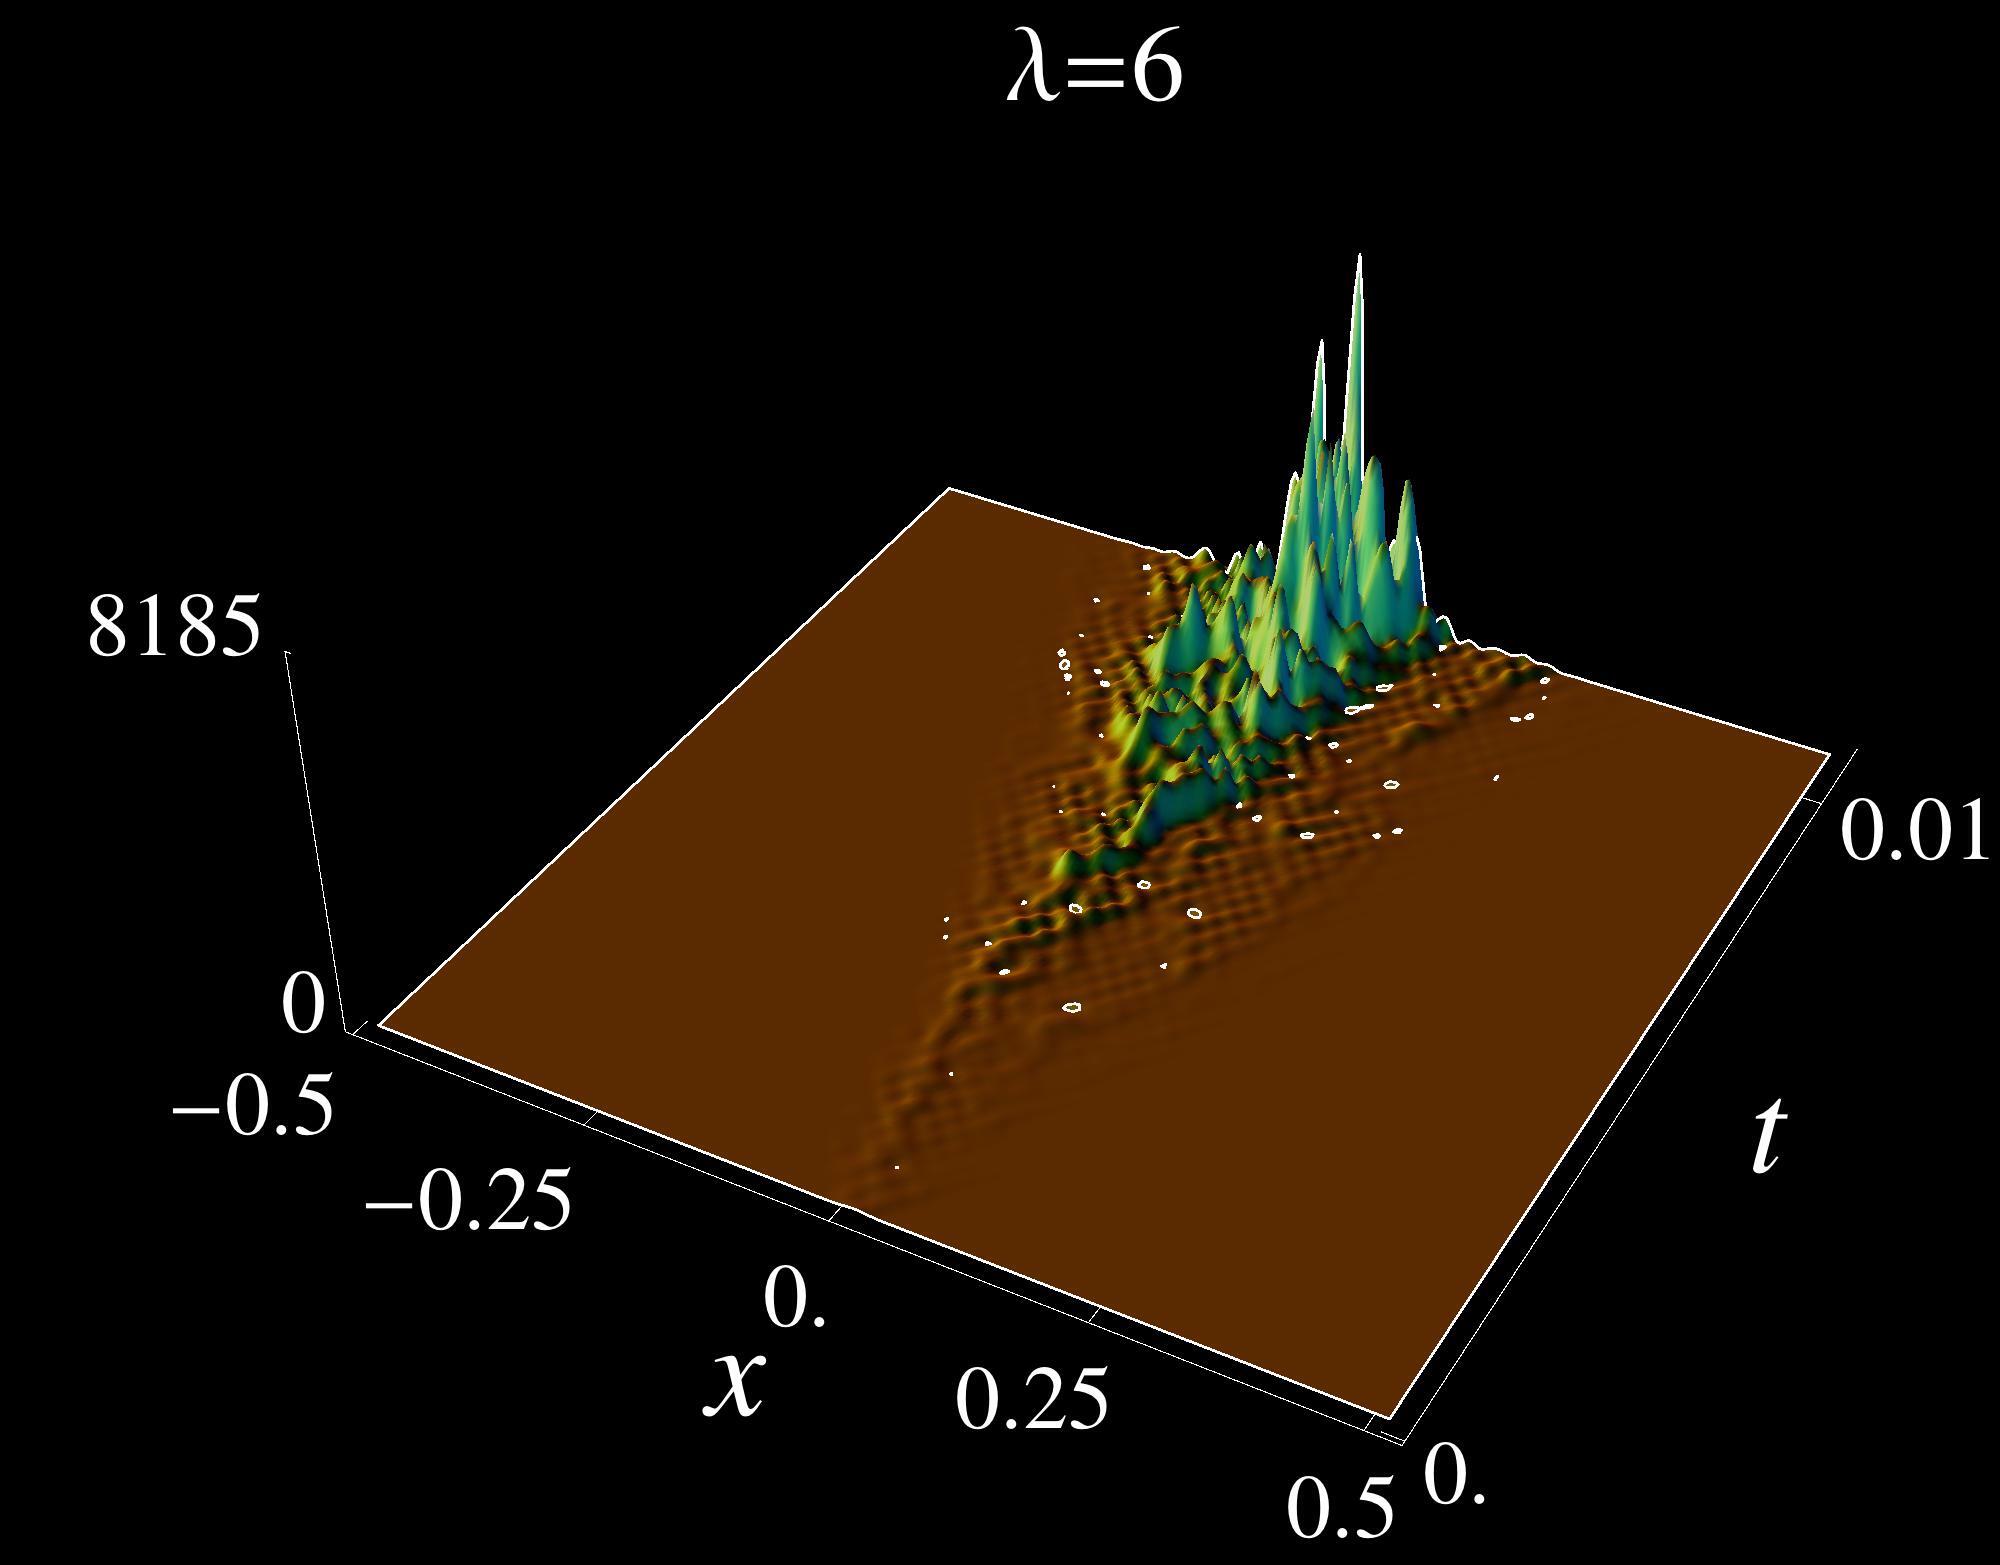 Lambda = 6 (Dark Background)
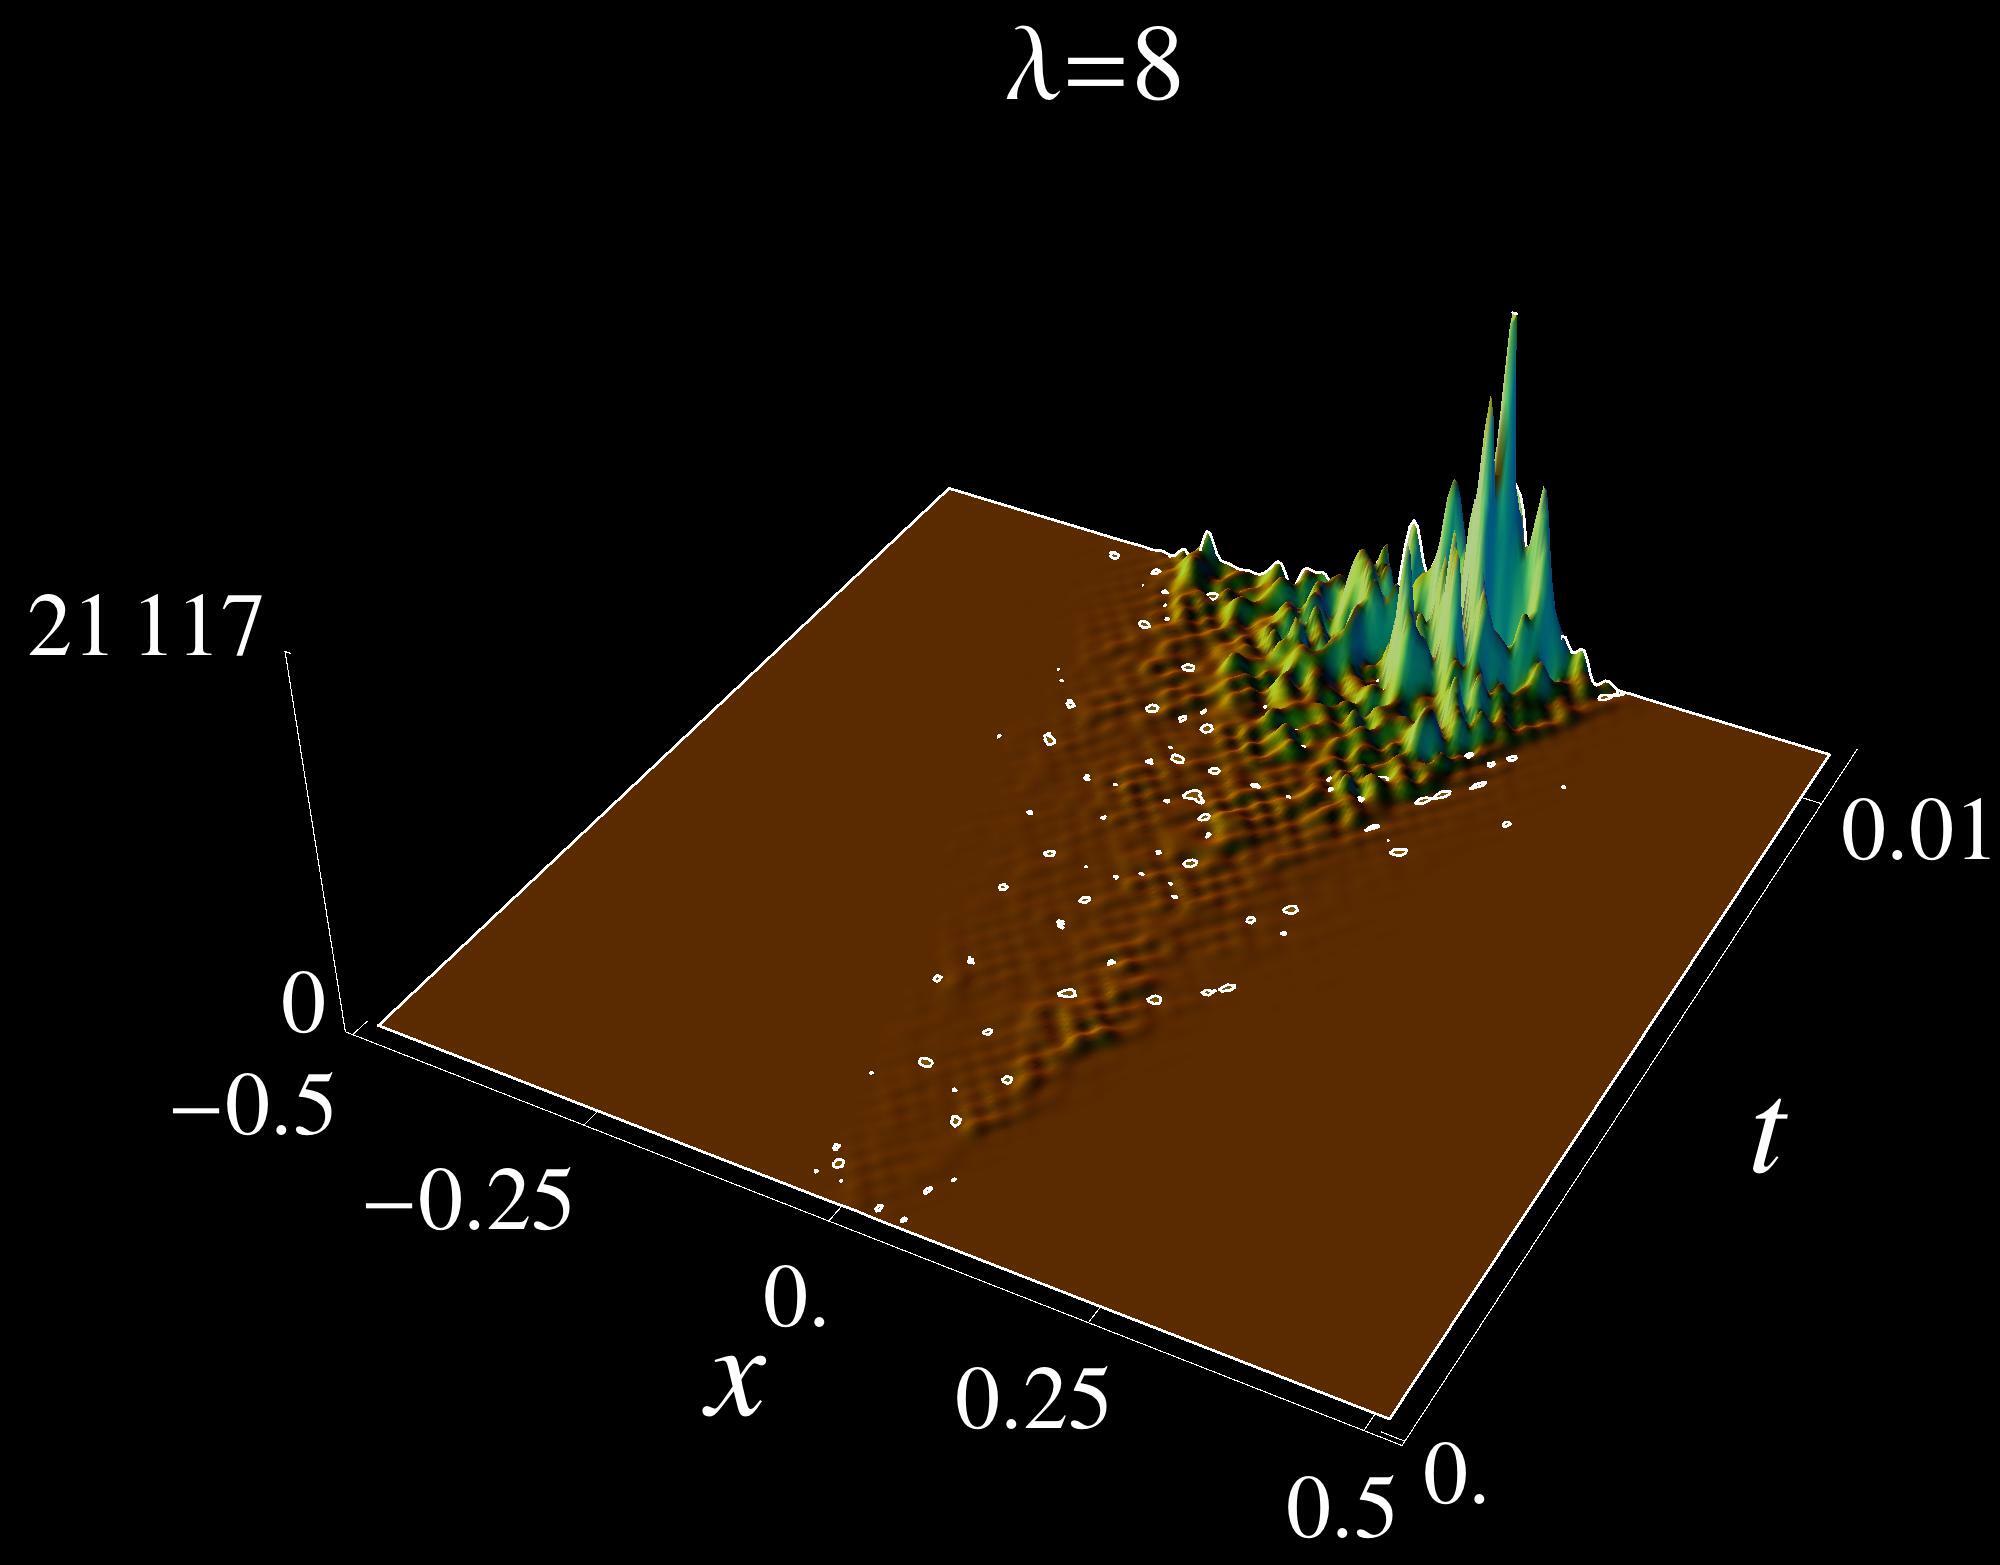 Lambda = 8 (Dark Background)
Other Formats
PDFs:
small_Delta_L0.pdf,small_Delta_L1.pdf,small_Delta_L2.pdf, …,small_Delta_L10.pdf
EPS:
small_Delta_L0.eps,small_Delta_L1.eps,small_Delta_L2.eps, …,small_Delta_L10.eps
DAT (Raw Data Files):
small_Delta_L0.dat,small_Delta_L1.dat,small_Delta_L2.dat, …,small_Delta_L10.dat
Explore the Full Repository
You can download all files and explore the complete collection on GitHub: SPDE-Visuals Repository.